【3.7.3】matplotlib-colormap(色图的例子get_cmap)
这些colormaps是如何定义,后续还需要琢磨一下,下面的仅供作图的时候的选择
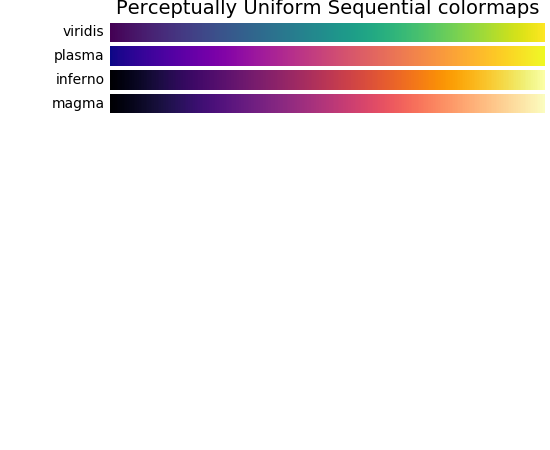
Perceptually Uniform Sequential colormaps
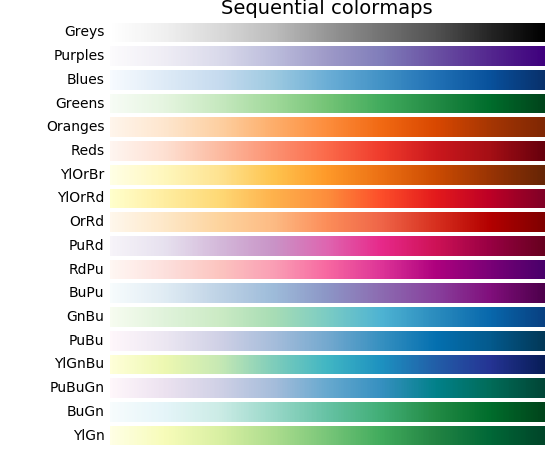
Sequential colormaps
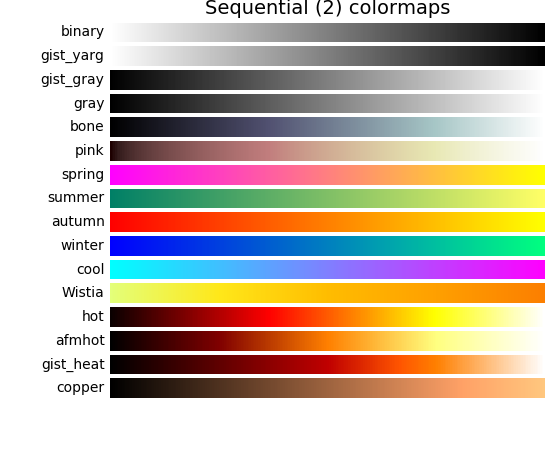
Sequential (2) colormaps
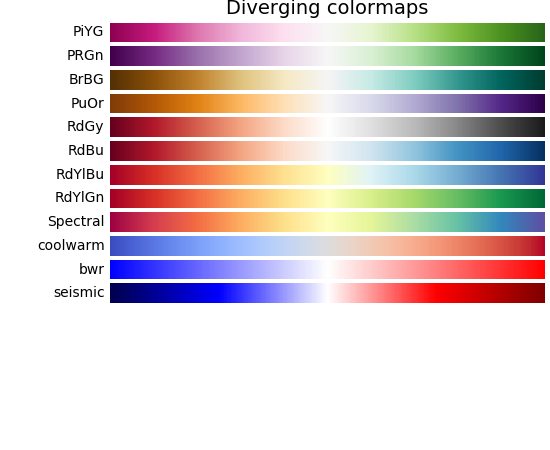
Diverging colormaps
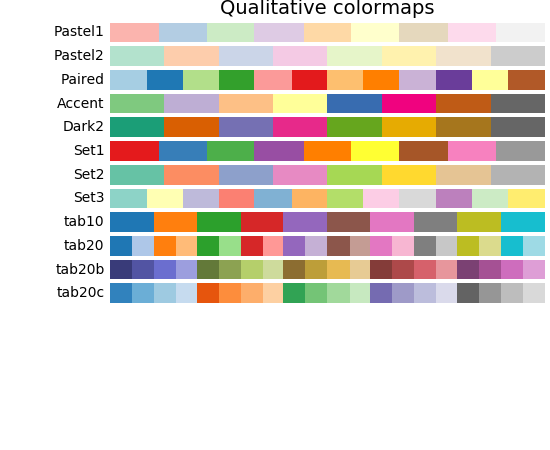
Qualitative colormaps
Miscellaneous colormaps

显示上图的代码
"""
==================
Colormap reference
==================

Reference for colormaps included with Matplotlib.

This reference example shows all colormaps included with Matplotlib. Note that
any colormap listed here can be reversed by appending "_r" (e.g., "pink_r").
These colormaps are divided into the following categories:

Sequential:
    These colormaps are approximately monochromatic colormaps varying smoothly
    between two color tones---usually from low saturation (e.g. white) to high
    saturation (e.g. a bright blue). Sequential colormaps are ideal for
    representing most scientific data since they show a clear progression from
    low-to-high values.

Diverging:
    These colormaps have a median value (usually light in color) and vary
    smoothly to two different color tones at high and low values. Diverging
    colormaps are ideal when your data has a median value that is significant
    (e.g.  0, such that positive and negative values are represented by
    different colors of the colormap).

Qualitative:
    These colormaps vary rapidly in color. Qualitative colormaps are useful for
    choosing a set of discrete colors. For example::

        color_list = plt.cm.Set3(np.linspace(0, 1, 12))

    gives a list of RGB colors that are good for plotting a series of lines on
    a dark background.

Miscellaneous:
    Colormaps that don't fit into the categories above.

"""
import numpy as np
import matplotlib.pyplot as plt


# Have colormaps separated into categories:
# http://matplotlib.org/examples/color/colormaps_reference.html
cmaps = [('Perceptually Uniform Sequential', [
            'viridis', 'plasma', 'inferno', 'magma']),
         ('Sequential', [
            'Greys', 'Purples', 'Blues', 'Greens', 'Oranges', 'Reds',
            'YlOrBr', 'YlOrRd', 'OrRd', 'PuRd', 'RdPu', 'BuPu',
            'GnBu', 'PuBu', 'YlGnBu', 'PuBuGn', 'BuGn', 'YlGn']),
         ('Sequential (2)', [
            'binary', 'gist_yarg', 'gist_gray', 'gray', 'bone', 'pink',
            'spring', 'summer', 'autumn', 'winter', 'cool', 'Wistia',
            'hot', 'afmhot', 'gist_heat', 'copper']),
         ('Diverging', [
            'PiYG', 'PRGn', 'BrBG', 'PuOr', 'RdGy', 'RdBu',
            'RdYlBu', 'RdYlGn', 'Spectral', 'coolwarm', 'bwr', 'seismic']),
         ('Qualitative', [
            'Pastel1', 'Pastel2', 'Paired', 'Accent',
            'Dark2', 'Set1', 'Set2', 'Set3',
            'tab10', 'tab20', 'tab20b', 'tab20c']),
         ('Miscellaneous', [
            'flag', 'prism', 'ocean', 'gist_earth', 'terrain', 'gist_stern',
            'gnuplot', 'gnuplot2', 'CMRmap', 'cubehelix', 'brg', 'hsv',
            'gist_rainbow', 'rainbow', 'jet', 'nipy_spectral', 'gist_ncar'])]


nrows = max(len(cmap_list) for cmap_category, cmap_list in cmaps)
gradient = np.linspace(0, 1, 256)
gradient = np.vstack((gradient, gradient))


def plot_color_gradients(cmap_category, cmap_list, nrows):
    fig, axes = plt.subplots(nrows=nrows)
    fig.subplots_adjust(top=0.95, bottom=0.01, left=0.2, right=0.99)
    axes[0].set_title(cmap_category + ' colormaps', fontsize=14)

    for ax, name in zip(axes, cmap_list):
        ax.imshow(gradient, aspect='auto', cmap=plt.get_cmap(name))
        pos = list(ax.get_position().bounds)
        x_text = pos[0] - 0.01
        y_text = pos[1] + pos[3]/2.
        fig.text(x_text, y_text, name, va='center', ha='right', fontsize=10)

    # Turn off *all* ticks & spines, not just the ones with colormaps.
    for ax in axes:
        ax.set_axis_off()


for cmap_category, cmap_list in cmaps:
    plot_color_gradients(cmap_category, cmap_list, nrows)

plt.show()
二、我的例子
2.1 值越大颜色越深
import matplotlib.pyplot as plt
colors = plt.get_cmap('OrRd')
color  = colors(value)
# color  = colors(0.1)
value为0到1之间的值
思路来源:
import matplotlib

cmap = matplotlib.cm.get_cmap('Spectral')
rgba = cmap(0.5)
print(rgba) # (0.99807766255210428, 0.99923106502084169, 0.74602077638401709, 1.0)
For values outside of the range [0.0, 1.0] it will return the under and over colour (respectively). This, by default, is the minimum and maximum colour within the range (so 0.0 and 1.0). This default can be changed with cmap.set_under() and cmap.set_over().
参考资料
药企,独角兽,苏州。团队长期招人,感兴趣的都可以发邮件聊聊:tiehan@sina.cn
![]() 个人公众号,比较懒,很少更新,可以在上面提问题,如果回复不及时,可发邮件给我: tiehan@sina.cn
个人公众号,比较懒,很少更新,可以在上面提问题,如果回复不及时,可发邮件给我: tiehan@sina.cn
