【3.1】matplotlib-legend
legend的几个特征:
- legend entry:A legend is made up of one or more legend entries. An entry is made up of exactly one key and one label.
- legend key:The colored/patterned marker to the left of each legend label.
- legend label:The text which describes the handle represented by the key.
- legend handle:The original object which is used to generate an appropriate entry in the legend.
ax与plt用法至少目前使用开看,是一样哒
一、legend_entry
handles, labels = ax.get_legend_handles_labels()
ax.legend(handles, labels)
指定legend
line_up, = plt.plot([1,2,3], label='Line 2')
line_down, = plt.plot([3,2,1], label='Line 1')
plt.legend(handles=[line_up, line_down])
有的时候,不持之handles,可以这样来:
line_up, = plt.plot([1,2,3], label='Line 2')
line_down, = plt.plot([3,2,1], label='Line 1')
plt.legend([line_up, line_down], ['Line Up', 'Line Down'])
二、自定义legend
2.1 好玩的样式
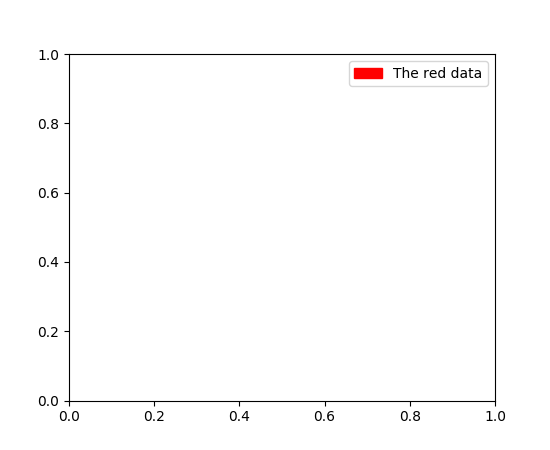
import matplotlib.patches as mpatches
import matplotlib.pyplot as plt

red_patch = mpatches.Patch(color='red', label='The red data')
plt.legend(handles=[red_patch])

plt.show()
2.2 也可以添加一些形状
import matplotlib.lines as mlines
import matplotlib.pyplot as plt

blue_line = mlines.Line2D([], [], color='blue', marker='*',
                          markersize=15, label='Blue stars')
plt.legend(handles=[blue_line])

plt.show()

2.3 设置图例边框及背景
plt.legend(loc='best',frameon=False) #去掉图例边框
plt.legend(loc='best',edgecolor='blue') #设置图例边框颜色
plt.legend(loc='best',facecolor='blue') #设置图例背景颜色,若无边框,参数无效
2.4 修改图例标题(title)
plt.legend(loc='best',title='figure 1 legend') #去掉图例边框

ax.legend(title='This is a legend')
2.5 获取并设置legend图例
plt.legend(loc=0, numpoints=1)
leg = plt.gca().get_legend() #或leg=ax.get_legend()
ltext = leg.get_texts()
plt.setp(ltext, fontsize=12,fontweight='bold')
2.6 设置图例
legend = ax.legend((rectsTest1, rectsTest2, rectsTest3), ('test1', 'test2', 'test3'))
legend = ax.legend(loc='upper center', shadow=True, fontsize='x-large')
legend.get_frame().set_facecolor('red') #设置图例legend背景为红色
frame = legend.get_frame()
frame.set_alpha(1)
frame.set_facecolor('none')  #设置图例legend背景透明
2.7 移除图例
ax1.legend_.remove() ##移除子图ax1中的图例
ax2.legend_.remove() ##移除子图ax2中的图例
ax3.legend_.remove() ##移除子图ax3中的图例
2.8 legend横着排列(ncol)

ax.legend(ncol=5, loc='upper center')
三、legend位置
3.1 一般用法
plt.legend(bbox_to_anchor=(1, 1),
           bbox_transform=plt.gcf().transFigure)
其他用法:
import matplotlib.pyplot as plt


plt.subplot(211)
plt.plot([1,2,3], label="test1")
plt.plot([3,2,1], label="test2")
# Place a legend above this subplot, expanding itself to
# fully use the given bounding box.
plt.legend(bbox_to_anchor=(0., 1.02, 1., .102), loc=3,
           ncol=2, mode="expand", borderaxespad=0.)

plt.subplot(223)
plt.plot([1,2,3], label="test1")
plt.plot([3,2,1], label="test2")
# Place a legend to the right of this smaller subplot.
plt.legend(bbox_to_anchor=(1.05, 1), loc=2, borderaxespad=0.)

plt.show()

loc的数字对应的位置:
| Location String | Location Code |
|---|---|
| ‘best’ | 0 |
| ‘upper right’ | 1 |
| ‘upper left’ | 2 |
| ‘lower left’ | 3 |
| ‘lower right’ | 4 |
| ‘right’ | 5 |
| ‘center left’ | 6 |
| ‘center right’ | 7 |
| ‘lower center’ | 8 |
| ‘upper center’ | 9 |
| ‘center’ | 10 |
3.2 设置图例legend到图形边界外
red_patch = mpatches.Patch(color='red', label='Typical Alpha Helix')
blue_patch = mpatches.Patch(color='blue', label='Typical Beta Strand')
hotpink_patch = mpatches.Patch(color='#FF00FF', label='Alike Alpha Helix')
green_patch = mpatches.Patch(color='#31A0DA', label='Alike Beta Strand')
black_patch = mpatches.Patch(color='black', label='Irregular ')

#主要是bbox_to_anchor的使用,给legend留出空间
box = ax1.get_position()
ax1.set_position([box.x0, box.y0, box.width*0.88 , box.height])
box2 = ax2.get_position()
ax2.set_position([box2.x0, box2.y0, box2.width*0.88 , box2.height])

ax1.legend(handles=[red_patch,blue_patch,hotpink_patch,green_patch,black_patch],loc=1, bbox_to_anchor=(1.0, 0.9),fontsize=40,bbox_transform=plt.gcf().transFigure)
详解:
- fontsize : 调解font字体大小
- loc : legend 的位置为右上角
- set_position : 先定义好图形的位置,这里是为了给legend留出空间,这一步很关键,不然legend死活出不来
- bbox_to_anchor : 选择legend位置
- bbox_transform : 与bbox_to_anchor搭配着用,bbox_to_anchor中的相对位置是在bbox_transform基础上定义的
四、一张图上多个legend
import matplotlib.pyplot as plt

line1, = plt.plot([1,2,3], label="Line 1", linestyle='--')
line2, = plt.plot([3,2,1], label="Line 2", linewidth=4)

# Create a legend for the first line.
first_legend = plt.legend(handles=[line1], loc=1)

# Add the legend manually to the current Axes.
ax = plt.gca().add_artist(first_legend)

# Create another legend for the second line.
plt.legend(handles=[line2], loc=4)

plt.show()

例子:
import matplotlib.pyplot as plt
from matplotlib.legend_handler import HandlerLine2D
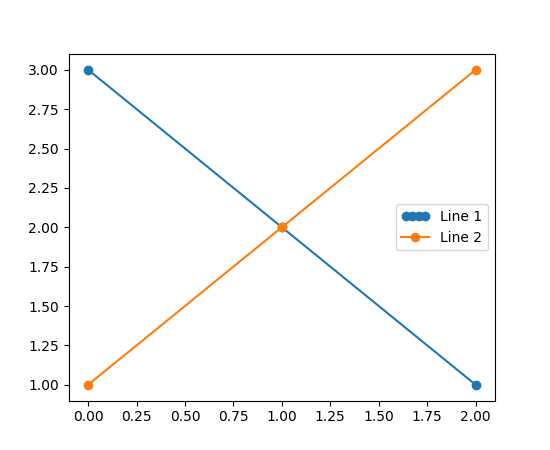
line1, = plt.plot([3,2,1], marker='o', label='Line 1')
line2, = plt.plot([1,2,3], marker='o', label='Line 2')
plt.legend(handler_map={line1: HandlerLine2D(numpoints=4)})
例子:
import matplotlib.pyplot as plt
from numpy.random import randn

z = randn(10)

red_dot, = plt.plot(z, "ro", markersize=15)
# Put a white cross over some of the data.
white_cross, = plt.plot(z[:5], "w+", markeredgewidth=3, markersize=15)

plt.legend([red_dot, (red_dot, white_cross)], ["Attr A", "Attr A+B"])

例子:
import matplotlib.pyplot as plt
import matplotlib.patches as mpatches
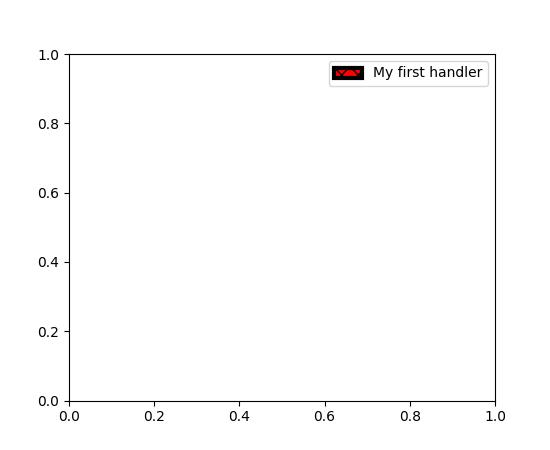
class AnyObject(object):
pass
class AnyObjectHandler(object):
def legend_artist(self, legend, orig_handle, fontsize, handlebox):
x0, y0 = handlebox.xdescent, handlebox.ydescent
width, height = handlebox.width, handlebox.height
patch = mpatches.Rectangle([x0, y0], width, height, facecolor='red',
edgecolor='black', hatch='xx', lw=3,
transform=handlebox.get_transform())
handlebox.add_artist(patch)
return patch
plt.legend([AnyObject()], ['My first handler'],
handler_map={AnyObject: AnyObjectHandler()})
例子:
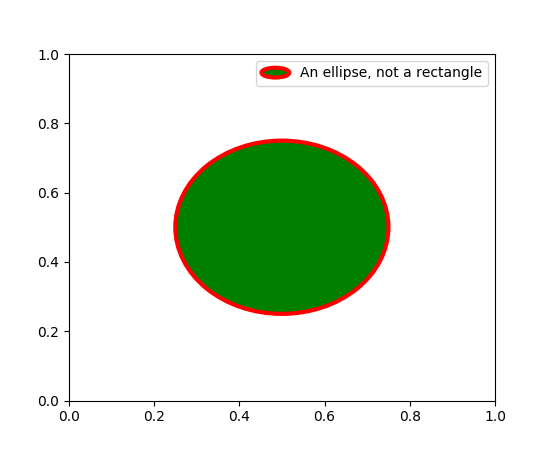
from matplotlib.legend_handler import HandlerPatch
import matplotlib.pyplot as plt
import matplotlib.patches as mpatches


class HandlerEllipse(HandlerPatch):
    def create_artists(self, legend, orig_handle,
                       xdescent, ydescent, width, height, fontsize, trans):
        center = 0.5 * width - 0.5 * xdescent, 0.5 * height - 0.5 * ydescent
        p = mpatches.Ellipse(xy=center, width=width + xdescent,
                             height=height + ydescent)
        self.update_prop(p, orig_handle, legend)
        p.set_transform(trans)
        return [p]


c = mpatches.Circle((0.5, 0.5), 0.25, facecolor="green",
                    edgecolor="red", linewidth=3)
plt.gca().add_patch(c)

plt.legend([c], ["An ellipse, not a rectangle"],
           handler_map={mpatches.Circle: HandlerEllipse()})
参考资料
药企,独角兽,苏州。团队长期招人,感兴趣的都可以发邮件聊聊:tiehan@sina.cn
![]() 个人公众号,比较懒,很少更新,可以在上面提问题,如果回复不及时,可发邮件给我: tiehan@sina.cn
个人公众号,比较懒,很少更新,可以在上面提问题,如果回复不及时,可发邮件给我: tiehan@sina.cn
