【3.3】matplotlib文本标注(text、annotate)
一、text
添加文本
text(x, y, s, fontsize=12)

text(0.5, 0.5, 'matplotlib', horizontalalignment='center',  verticalalignment='center', transform=ax.transAxes)

text(x, y, s, bbox=dict(facecolor='red', alpha=0.5))
位置调整:
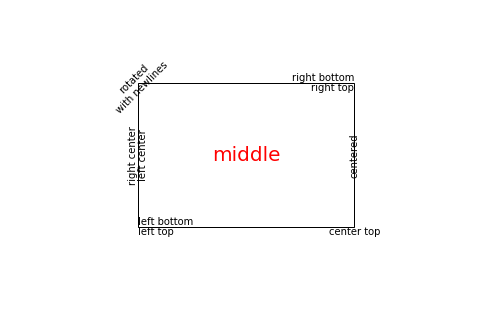
import matplotlib.pyplot as plt
import matplotlib.patches as patches

# build a rectangle in axes coords
left, width = .25, .5
bottom, height = .25, .5
right = left + width
top = bottom + height

fig = plt.figure()
ax = fig.add_axes([0,0,1,1])

# axes coordinates are 0,0 is bottom left and 1,1 is upper right
p = patches.Rectangle(
    (left, bottom), width, height,
    fill=False, transform=ax.transAxes, clip_on=False
    )

ax.add_patch(p)

ax.text(left, bottom, 'left top',
        horizontalalignment='left',
        verticalalignment='top',
        transform=ax.transAxes)

ax.text(left, bottom, 'left bottom',
        horizontalalignment='left',
        verticalalignment='bottom',
        transform=ax.transAxes)

ax.text(right, top, 'right bottom',
        horizontalalignment='right',
        verticalalignment='bottom',
        transform=ax.transAxes)

ax.text(right, top, 'right top',
        horizontalalignment='right',
        verticalalignment='top',
        transform=ax.transAxes)

ax.text(right, bottom, 'center top',
        horizontalalignment='center',
        verticalalignment='top',
        transform=ax.transAxes)

ax.text(left, 0.5*(bottom+top), 'right center',
        horizontalalignment='right',
        verticalalignment='center',
        rotation='vertical',
        transform=ax.transAxes)

ax.text(left, 0.5*(bottom+top), 'left center',
        horizontalalignment='left',
        verticalalignment='center',
        rotation='vertical',
        transform=ax.transAxes)

ax.text(0.5*(left+right), 0.5*(bottom+top), 'middle',
        horizontalalignment='center',
        verticalalignment='center',
        fontsize=20, color='red',
        transform=ax.transAxes)

ax.text(right, 0.5*(bottom+top), 'centered',
        horizontalalignment='center',
        verticalalignment='center',
        rotation='vertical',
        transform=ax.transAxes)

ax.text(left, top, 'rotated\nwith newlines',
        horizontalalignment='center',
        verticalalignment='center',
        rotation=45,
        transform=ax.transAxes)

ax.set_axis_off()
plt.show()
二、annotate
2.1 参数说明
plt.annotate(s, xy, xytext=None, xycoords=None, textcoords)
在图表中进行标注,重要参数说明如下:
s:标注的字符串
xy:标注所在的位置
xytext:如果有规定,则文字位置以该参数为准,通过一个箭头指向 xy 所在位置
xycoords:xy 坐标系统
‘data’:沿用所标注对象的坐标方式
‘figure points’:从画布的左下角,按照“点”来计算
‘figure pixels’:从画布的左下角,按照“像素”来计算
‘figure fraction’:从画布的左下角,按照“比例”来计算
‘axes points’:从图表的左下角,按照“点”来计算
‘axes pixels’:从图表的左下角,按照“像素”来计算
‘axes fraction’:从图表的左下角,按照“比例”来计算
‘polar’:极坐标
textcoords:xytext 的坐标体系
包括所有 xycoords 的方式
‘offset points’:从 xy 处,按照“点”来计算
‘offset pixels’:从 xy 处,按照“像素”来计算
2.2 具体例子
内容固定在左上角的位置
plt.annotate('something', xy=(0.05, 0.9), xycoords='axes fraction',color='red')
三、更多案例
使用text()会将文本放置在轴域的任意位置。 文本的一个常见用例是标注绘图的某些特征,而annotate()方法提供辅助函数,使标注变得容易。 在标注中,有两个要考虑的点:由参数xy表示的标注位置和xytext的文本位置。 这两个参数都是(x, y)元组。
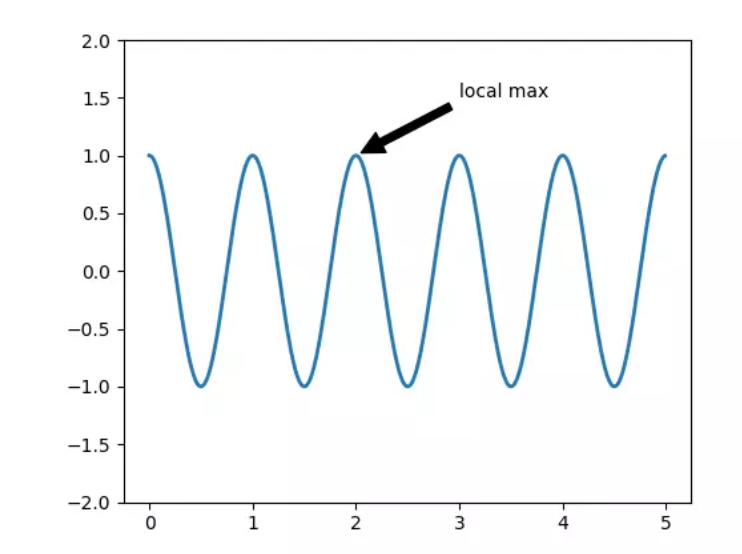
import numpy as np
import matplotlib.pyplot as plt

fig = plt.figure()
ax = fig.add_subplot(111)

t = np.arange(0.0, 5.0, 0.01)
s = np.cos(2*np.pi*t)
line, = ax.plot(t, s, lw=2)

ax.annotate('local max', xy=(2, 1), xytext=(3, 1.5),
            arrowprops=dict(facecolor='black', shrink=0.05),
            )

ax.set_ylim(-2,2)
plt.show()
在该示例中,xy(箭头尖端)和xytext位置(文本位置)都以数据坐标为单位。 有多种可以选择的其他坐标系 - 你可以使用xycoords和textcoords以及下列字符串之一(默认为data)指定xy和xytext的坐标系。
| 参数 | 坐标系 |
|---|---|
| ‘figure points’ | 距离图形左下角的点数量 |
| ‘figure pixels’ | 距离图形左下角的像素数量 |
| ‘figure fraction’ | 0,0 是图形左下角,1,1 是右上角 |
| ‘axes points’ | 距离轴域左下角的点数量 |
| ‘axes pixels’ | 距离轴域左下角的像素数量 |
| ‘axes fraction’ | 0,0 是轴域左下角,1,1 是右上角 |
| ‘data’ | 使用轴域数据坐标系 |
例如将文本以轴域小数坐标系来放置,我们可以:
ax.annotate('local max', xy=(3, 1),  xycoords='data',
            xytext=(0.8, 0.95), textcoords='axes fraction',
            arrowprops=dict(facecolor='black', shrink=0.05),
            horizontalalignment='right', verticalalignment='top',
            )
对于物理坐标系(点或像素),原点是图形或轴的左下角。
或者,你可以通过在可选关键字参数arrowprops中提供箭头属性字典来绘制从文本到注释点的箭头。
| arrowprops键 | 描述 |
|---|---|
| width | 箭头宽度,以点为单位 |
| frac | 箭头头部所占据的比例 |
| headwidth | 箭头的底部的宽度,以点为单位 |
| shrink | 移动提示,并使其离注释点和文本一些距离 |
| **kwargs | matplotlib.patches.Polygon的任何键,例如facecolor |
在下面的示例中,xy点是原始坐标(xycoords默认为’data')。 对于极坐标轴,它在(theta, radius)空间中。 此示例中的文本放置在图形小数坐标系中。 matplotlib.text.Text关键字args,例如horizontalalignment,verticalalignment和fontsize,从annotate传给Text实例。
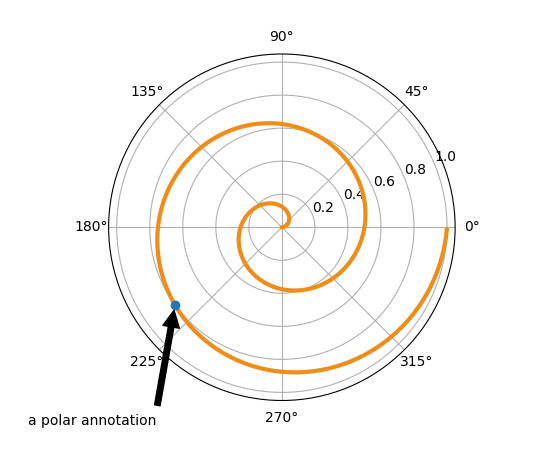
import numpy as np
import matplotlib.pyplot as plt

fig = plt.figure()
ax = fig.add_subplot(111, polar=True)
r = np.arange(0,1,0.001)
theta = 2*2*np.pi*r
line, = ax.plot(theta, r, color='#ee8d18', lw=3)

ind = 800
thisr, thistheta = r[ind], theta[ind]
ax.plot([thistheta], [thisr], 'o')
ax.annotate('a polar annotation',
            xy=(thistheta, thisr),  # theta, radius
            xytext=(0.05, 0.05),    # fraction, fraction
            textcoords='figure fraction',
            arrowprops=dict(facecolor='black', shrink=0.05),
            horizontalalignment='left',
            verticalalignment='bottom',
            )
plt.show()
四、高级注释
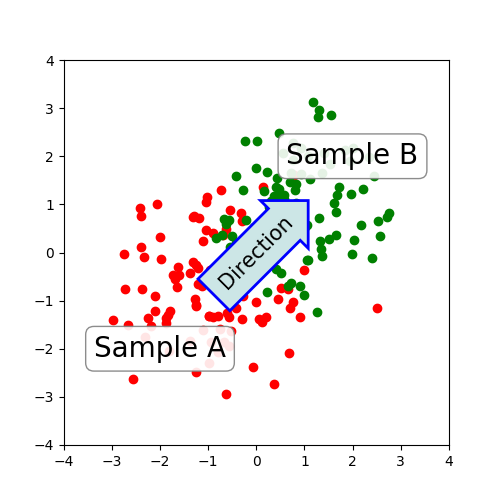
4.1 使用框和文本来标注
让我们以一个简单的例子来开始。
import numpy.random
import matplotlib.pyplot as plt

fig = plt.figure(1, figsize=(5,5))
fig.clf()

ax = fig.add_subplot(111)
ax.set_aspect(1)

x1 = -1 + numpy.random.randn(100)
y1 = -1 + numpy.random.randn(100)
x2 = 1. + numpy.random.randn(100)
y2 = 1. + numpy.random.randn(100)

ax.scatter(x1, y1, color="r")
ax.scatter(x2, y2, color="g")

bbox_props = dict(boxstyle="round", fc="w", ec="0.5", alpha=0.9)
ax.text(-2, -2, "Sample A", ha="center", va="center", size=20,
        bbox=bbox_props)
ax.text(2, 2, "Sample B", ha="center", va="center", size=20,
        bbox=bbox_props)


bbox_props = dict(boxstyle="rarrow", fc=(0.8,0.9,0.9), ec="b", lw=2)
t = ax.text(0, 0, "Direction", ha="center", va="center", rotation=45,
            size=15,
            bbox=bbox_props)

bb = t.get_bbox_patch()
bb.set_boxstyle("rarrow", pad=0.6)

ax.set_xlim(-4, 4)
ax.set_ylim(-4, 4)

plt.draw()
plt.show()
在pyplot模块(或Axes类的text方法)中的text()函数接受bbox关键字参数,并且在提供时,在文本周围绘制一个框。 与文本相关联的补丁对象可以通过以下方式访问:
bb = t.get_bbox_patch()
返回值是FancyBboxPatch的一个实例,并且补丁属性(如facecolor,edgewidth等)可以像平常一样访问和修改。 为了更改框的形状,请使用set_boxstyle方法。
bb.set_boxstyle("rarrow", pad=0.6)
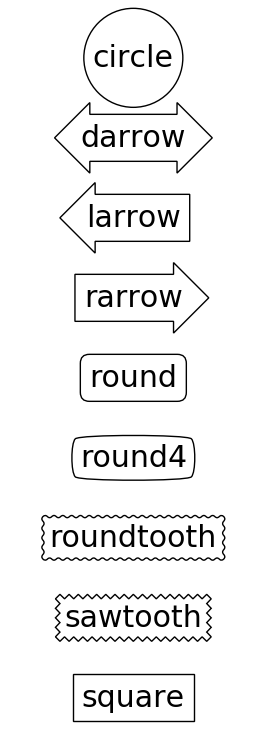
该参数是框样式的名称与其作为关键字参数的属性。 目前,实现了以下框样式。
| 类 | 名称 | 属性 |
|---|---|---|
| Circle | circle | pad=0.3 |
| DArrow | darrow | pad=0.3 |
| LArrow | larrow | pad=0.3 |
| RArrow | rarrow | pad=0.3 |
| Round | round | pad=0.3,rounding_size=None |
| Round4 | round4 | pad=0.3,rounding_size=None |
| Roundtooth | roundtooth | pad=0.3,tooth_size=None |
| Sawtooth | sawtooth | pad=0.3,tooth_size=None |
| Square | square | pad=0.3 |
示例:
代码:
import matplotlib.patches as mpatch
import matplotlib.pyplot as plt

styles = mpatch.BoxStyle.get_styles()
spacing = 1.2

figheight = (spacing * len(styles) + .5)
fig1 = plt.figure(1, (4/1.5, figheight/1.5))
fontsize = 0.3 * 72

for i, stylename in enumerate(sorted(styles.keys())):
    fig1.text(0.5, (spacing * (float(len(styles)) - i) - 0.5)/figheight, stylename,
              ha="center",
              size=fontsize,
              transform=fig1.transFigure,
              bbox=dict(boxstyle=stylename, fc="w", ec="k"))
plt.draw()
plt.show()
注意,属性参数可以在样式名称中用逗号分隔(在初始化文本实例时,此形式可以用作bbox参数的boxstyle的值)。
bb.set_boxstyle("rarrow,pad=0.6")
4.2 使用箭头来标注
pyplot模块(或Axes类的annotate方法)中的annotate()函数用于绘制连接图上两点的箭头。
ax.annotate("Annotation",
    xy=(x1, y1), xycoords='data',
    xytext=(x2, y2), textcoords='offset points',
    )
这会使用textcoords中提供的,xytext处的文本标注提供坐标(xycoords)中的xy处的点。 通常,数据坐标中规定了标注点,偏移点中规定了标注文本。 请参阅annotate()了解可用的坐标系。 连接两个点(xy和xytext)的箭头可以通过指定arrowprops参数可选地绘制。 为了仅绘制箭头,请使用空字符串作为第一个参数。
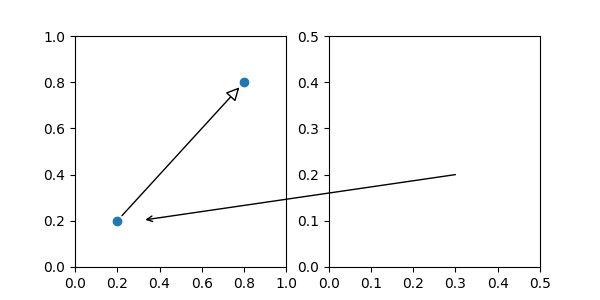
ax.annotate("",
            xy=(0.2, 0.2), xycoords='data',
            xytext=(0.8, 0.8), textcoords='data',
            arrowprops=dict(arrowstyle="->",
                            connectionstyle="arc3"),
            )

import matplotlib.pyplot as plt

plt.figure(1, figsize=(3,3))
ax = plt.subplot(111)

ax.annotate("",
            xy=(0.2, 0.2), xycoords='data',
            xytext=(0.8, 0.8), textcoords='data',
            arrowprops=dict(arrowstyle="->",
                            connectionstyle="arc3"),
            )

plt.show()
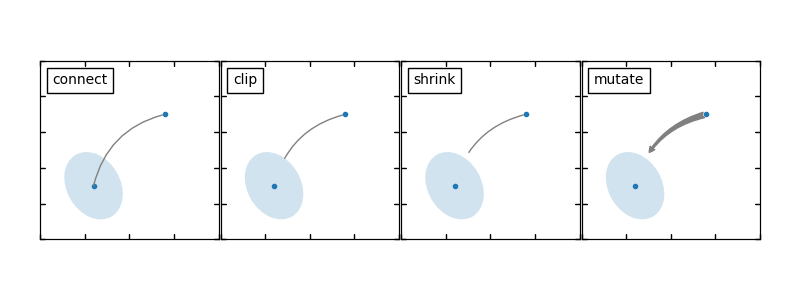
箭头的绘制需要几个步骤。
- 创建两个点之间的连接路径。 这由connectionstyle键值控制。
- 如果提供了补丁对象(patchA和patchB),则会剪切路径以避开该补丁。
- 路径进一步由提供的像素总量来缩小(shirnkA&shrinkB)
- 路径转换为箭头补丁,由arrowstyle键值控制。
import matplotlib.pyplot as plt
import matplotlib.patches as mpatches

x1, y1 = 0.3, 0.3
x2, y2 = 0.7, 0.7

fig = plt.figure(1, figsize=(8,3))
fig.clf()
from mpl_toolkits.axes_grid.axes_grid import AxesGrid
from mpl_toolkits.axes_grid.anchored_artists import AnchoredText

#from matplotlib.font_manager import FontProperties

def add_at(ax, t, loc=2):
    fp = dict(size=10)
    _at = AnchoredText(t, loc=loc, prop=fp)
    ax.add_artist(_at)
    return _at


grid = AxesGrid(fig, 111, (1, 4), label_mode="1", share_all=True)

grid[0].set_autoscale_on(False)

ax = grid[0]
ax.plot([x1, x2], [y1, y2], ".")
el = mpatches.Ellipse((x1, y1), 0.3, 0.4, angle=30, alpha=0.2)
ax.add_artist(el)
ax.annotate("",
            xy=(x1, y1), xycoords='data',
            xytext=(x2, y2), textcoords='data',
            arrowprops=dict(arrowstyle="-", #linestyle="dashed",
                            color="0.5",
                            patchB=None,
                            shrinkB=0,
                            connectionstyle="arc3,rad=0.3",
                            ),
            )

add_at(ax, "connect", loc=2)

ax = grid[1]
ax.plot([x1, x2], [y1, y2], ".")
el = mpatches.Ellipse((x1, y1), 0.3, 0.4, angle=30, alpha=0.2)
ax.add_artist(el)
ax.annotate("",
            xy=(x1, y1), xycoords='data',
            xytext=(x2, y2), textcoords='data',
            arrowprops=dict(arrowstyle="-", #linestyle="dashed",
                            color="0.5",
                            patchB=el,
                            shrinkB=0,
                            connectionstyle="arc3,rad=0.3",
                            ),
            )

add_at(ax, "clip", loc=2)


ax = grid[2]
ax.plot([x1, x2], [y1, y2], ".")
el = mpatches.Ellipse((x1, y1), 0.3, 0.4, angle=30, alpha=0.2)
ax.add_artist(el)
ax.annotate("",
            xy=(x1, y1), xycoords='data',
            xytext=(x2, y2), textcoords='data',
            arrowprops=dict(arrowstyle="-", #linestyle="dashed",
                            color="0.5",
                            patchB=el,
                            shrinkB=5,
                            connectionstyle="arc3,rad=0.3",
                            ),
            )

add_at(ax, "shrink", loc=2)


ax = grid[3]
ax.plot([x1, x2], [y1, y2], ".")
el = mpatches.Ellipse((x1, y1), 0.3, 0.4, angle=30, alpha=0.2)
ax.add_artist(el)
ax.annotate("",
            xy=(x1, y1), xycoords='data',
            xytext=(x2, y2), textcoords='data',
            arrowprops=dict(arrowstyle="fancy", #linestyle="dashed",
                            color="0.5",
                            patchB=el,
                            shrinkB=5,
                            connectionstyle="arc3,rad=0.3",
                            ),
            )

add_at(ax, "mutate", loc=2)

grid[0].set_xlim(0, 1)
grid[0].set_ylim(0, 1)
grid[0].axis["bottom"].toggle(ticklabels=False)
grid[0].axis["left"].toggle(ticklabels=False)
fig.subplots_adjust(left=0.05, right=0.95, bottom=0.05, top=0.95)

plt.draw()
plt.show()
两个点之间的连接路径的创建由connectionstyle键控制,并且可用以下样式。
| 名称 | 属性 |
|---|---|
| angle | angleA=90,angleB=0,rad=0.0 |
| angle3 | angleA=90,angleB=0 |
| arc | angleA=0,angleB=0,armA=None,armB=None,rad=0.0 |
| arc3 | rad=0.0 |
| bar | armA=0.0,armB=0.0,fraction=0.3,angle=None |
注意,angle3和arc3中的3意味着所得到的路径是二次样条段(三个控制点)。 如下面将讨论的,当连接路径是二次样条时,可以使用一些箭头样式选项。
每个连接样式的行为在下面的示例中(有限地)演示。 (警告:条形样式的行为当前未定义好,将来可能会更改)。

import matplotlib.pyplot as plt
import matplotlib.patches as mpatches

fig = plt.figure(1, figsize=(8,5))
fig.clf()
from mpl_toolkits.axes_grid.axes_grid import AxesGrid
from mpl_toolkits.axes_grid.anchored_artists import AnchoredText

#from matplotlib.font_manager import FontProperties

def add_at(ax, t, loc=2):
    fp = dict(size=8)
    _at = AnchoredText(t, loc=loc, prop=fp)
    ax.add_artist(_at)
    return _at


grid = AxesGrid(fig, 111, (3, 5), label_mode="1", share_all=True)

grid[0].set_autoscale_on(False)


x1, y1 = 0.3, 0.3
x2, y2 = 0.7, 0.7


def demo_con_style(ax, connectionstyle, label=None):

    if label is None:
        label = connectionstyle

    x1, y1 = 0.3, 0.2
    x2, y2 = 0.8, 0.6

    ax.plot([x1, x2], [y1, y2], ".")
    ax.annotate("",
                xy=(x1, y1), xycoords='data',
                xytext=(x2, y2), textcoords='data',
                arrowprops=dict(arrowstyle="->", #linestyle="dashed",
                                color="0.5",
                                shrinkA=5, shrinkB=5,
                                patchA=None,
                                patchB=None,
                                connectionstyle=connectionstyle,
                                ),
                )

    add_at(ax, label, loc=2)

column = grid.axes_column[0]

demo_con_style(column[0], "angle3,angleA=90,angleB=0",
               label="angle3,\nangleA=90,\nangleB=0")
demo_con_style(column[1], "angle3,angleA=0,angleB=90",
               label="angle3,\nangleA=0,\nangleB=90")


column = grid.axes_column[1]

demo_con_style(column[0], "arc3,rad=0.")
demo_con_style(column[1], "arc3,rad=0.3")
demo_con_style(column[2], "arc3,rad=-0.3")


column = grid.axes_column[2]

demo_con_style(column[0], "angle,angleA=-90,angleB=180,rad=0",
               label="angle,\nangleA=-90,\nangleB=180,\nrad=0")
demo_con_style(column[1], "angle,angleA=-90,angleB=180,rad=5",
               label="angle,\nangleA=-90,\nangleB=180,\nrad=5")
demo_con_style(column[2], "angle,angleA=-90,angleB=10,rad=5",
               label="angle,\nangleA=-90,\nangleB=10,\nrad=0")


column = grid.axes_column[3]

demo_con_style(column[0], "arc,angleA=-90,angleB=0,armA=30,armB=30,rad=0",
               label="arc,\nangleA=-90,\nangleB=0,\narmA=30,\narmB=30,\nrad=0")
demo_con_style(column[1], "arc,angleA=-90,angleB=0,armA=30,armB=30,rad=5",
               label="arc,\nangleA=-90,\nangleB=0,\narmA=30,\narmB=30,\nrad=5")
demo_con_style(column[2], "arc,angleA=-90,angleB=0,armA=0,armB=40,rad=0",
               label="arc,\nangleA=-90,\nangleB=0,\narmA=0,\narmB=40,\nrad=0")


column = grid.axes_column[4]

demo_con_style(column[0], "bar,fraction=0.3",
               label="bar,\nfraction=0.3")
demo_con_style(column[1], "bar,fraction=-0.3",
               label="bar,\nfraction=-0.3")
demo_con_style(column[2], "bar,angle=180,fraction=-0.2",
               label="bar,\nangle=180,\nfraction=-0.2")


#demo_con_style(column[1], "arc3,rad=0.3")
#demo_con_style(column[2], "arc3,rad=-0.3")


grid[0].set_xlim(0, 1)
grid[0].set_ylim(0, 1)
grid.axes_llc.axis["bottom"].toggle(ticklabels=False)
grid.axes_llc.axis["left"].toggle(ticklabels=False)
fig.subplots_adjust(left=0.05, right=0.95, bottom=0.05, top=0.95)

plt.draw()
plt.show()
然后根据给定的箭头样式将连接路径(在剪切和收缩之后)变换为箭头补丁。
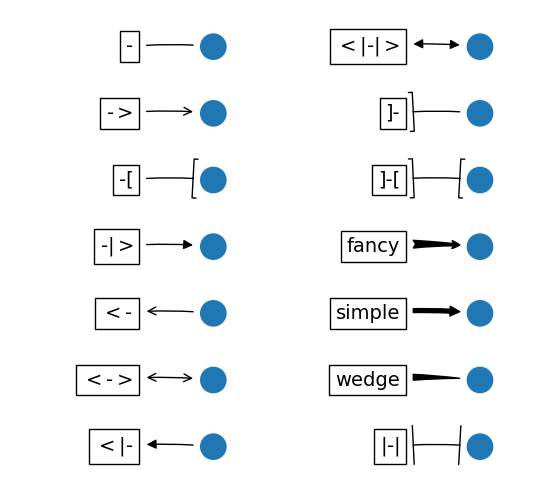
Name	|Attrs
-	None
->	head_length=0.4,head_width=0.2
-[	widthB=1.0,lengthB=0.2,angleB=None
|-|	widthA=1.0,widthB=1.0
-|>	head_length=0.4,head_width=0.2
<-	head_length=0.4,head_width=0.2
<->	head_length=0.4,head_width=0.2
<|-	head_length=0.4,head_width=0.2
<|-|>	head_length=0.4,head_width=0.2
fancy	head_length=0.4,head_width=0.4,tail_width=0.4
simple	head_length=0.5,head_width=0.5,tail_width=0.2
wedge	tail_width=0.3,shrink_factor=0.5
import matplotlib.patches as mpatches
import matplotlib.pyplot as plt

styles = mpatches.ArrowStyle.get_styles()

ncol = 2
nrow = (len(styles) + 1) // ncol
figheight = (nrow + 0.5)
fig1 = plt.figure(1, (4.*ncol/1.5, figheight/1.5))
fontsize = 0.2 * 70


ax = fig1.add_axes([0, 0, 1, 1], frameon=False, aspect=1.)

ax.set_xlim(0, 4*ncol)
ax.set_ylim(0, figheight)


def to_texstring(s):
    s = s.replace("<", r"$<$")
    s = s.replace(">", r"$>$")
    s = s.replace("|", r"$|$")
    return s

for i, (stylename, styleclass) in enumerate(sorted(styles.items())):
    x = 3.2 + (i//nrow)*4
    y = (figheight - 0.7 - i % nrow)  # /figheight
    p = mpatches.Circle((x, y), 0.2)
    ax.add_patch(p)

    ax.annotate(to_texstring(stylename), (x, y),
                (x - 1.2, y),
                #xycoords="figure fraction", textcoords="figure fraction",
                ha="right", va="center",
                size=fontsize,
                arrowprops=dict(arrowstyle=stylename,
                                patchB=p,
                                shrinkA=5,
                                shrinkB=5,
                                fc="k", ec="k",
                                connectionstyle="arc3,rad=-0.05",
                                ),
                bbox=dict(boxstyle="square", fc="w"))

ax.xaxis.set_visible(False)
ax.yaxis.set_visible(False)


plt.draw()
plt.show()
一些箭头仅适用于生成二次样条线段的连接样式。 他们是fancy,simple,wedge。 对于这些箭头样式,必须使用angle3或arc3连接样式。
如果提供了标注字符串,则patchA默认设置为文本的bbox补丁。
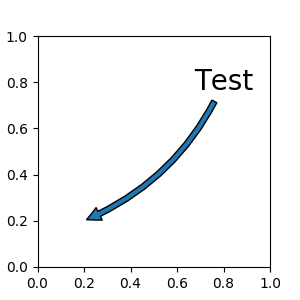
import matplotlib.pyplot as plt

plt.figure(1, figsize=(3,3))
ax = plt.subplot(111)

ax.annotate("Test",
            xy=(0.2, 0.2), xycoords='data',
            xytext=(0.8, 0.8), textcoords='data',
            size=20, va="center", ha="center",
            arrowprops=dict(arrowstyle="simple",
                            connectionstyle="arc3,rad=-0.2"),
            )

plt.show()
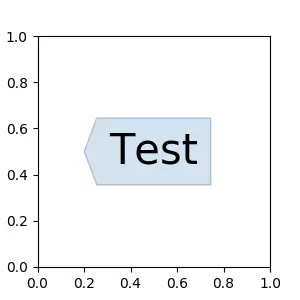
与text命令一样,可以使用bbox参数来绘制文本周围的框。
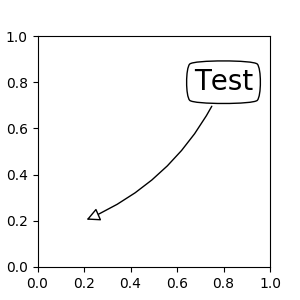
import matplotlib.pyplot as plt

plt.figure(1, figsize=(3,3))
ax = plt.subplot(111)

ann = ax.annotate("Test",
                  xy=(0.2, 0.2), xycoords='data',
                  xytext=(0.8, 0.8), textcoords='data',
                  size=20, va="center", ha="center",
                  bbox=dict(boxstyle="round4", fc="w"),
                  arrowprops=dict(arrowstyle="-|>",
                                  connectionstyle="arc3,rad=-0.2",
                                  fc="w"),
                  )

plt.show()
默认情况下,起点设置为文本范围的中心。 可以使用relpos键值进行调整。 这些值根据文本的范围进行归一化。 例如,(0,0)表示左下角,(1,1)表示右上角。

import matplotlib.pyplot as plt

plt.figure(1, figsize=(3,3))
ax = plt.subplot(111)

ann = ax.annotate("Test",
                  xy=(0.2, 0.2), xycoords='data',
                  xytext=(0.8, 0.8), textcoords='data',
                  size=20, va="center", ha="center",
                  bbox=dict(boxstyle="round4", fc="w"),
                  arrowprops=dict(arrowstyle="-|>",
                                  connectionstyle="arc3,rad=0.2",
                                  relpos=(0., 0.),
                                  fc="w"),
                  )

ann = ax.annotate("Test",
                  xy=(0.2, 0.2), xycoords='data',
                  xytext=(0.8, 0.8), textcoords='data',
                  size=20, va="center", ha="center",
                  bbox=dict(boxstyle="round4", fc="w"),
                  arrowprops=dict(arrowstyle="-|>",
                                  connectionstyle="arc3,rad=-0.2",
                                  relpos=(1., 0.),
                                  fc="w"),
                  )

plt.show()
4.3
有一类艺术家可以放置在轴域的锚定位置。 一个常见的例子是图例。 这种类型的艺术家可以使用OffsetBox类创建。 mpl_toolkits.axes_grid.anchored_artists中有几个预定义类。
from mpl_toolkits.axes_grid.anchored_artists import AnchoredText
at = AnchoredText("Figure 1a",
                  prop=dict(size=8), frameon=True,
                  loc=2,
                  )
at.patch.set_boxstyle("round,pad=0.,rounding_size=0.2")
ax.add_artist(at)
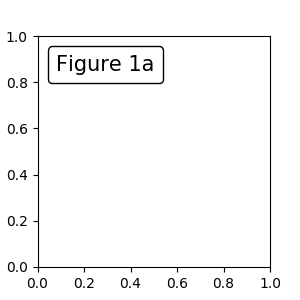
loc关键字与legend命令中含义相同。
一个简单的应用是当艺术家(或艺术家的集合)的像素大小在创建时已知。 例如,如果要绘制一个固定大小为 20 像素 ×20 像素(半径为 10 像素)的圆,则可以使用AnchoredDrawingArea。 实例使用绘图区域的大小创建(以像素为单位)。 用户可以在绘图区任意添加艺术家。 注意,添加到绘图区域的艺术家的范围与绘制区域本身的位置无关,只和初始大小有关。
from mpl_toolkits.axes_grid.anchored_artists import AnchoredDrawingArea

ada = AnchoredDrawingArea(20, 20, 0, 0,
                          loc=1, pad=0., frameon=False)
p1 = Circle((10, 10), 10)
ada.drawing_area.add_artist(p1)
p2 = Circle((30, 10), 5, fc="r")
ada.drawing_area.add_artist(p2)
添加到绘图区域的艺术家不应该具有变换集(它们将被重写),并且那些艺术家的尺寸被解释为像素坐标,即,上述示例中的圆的半径分别是 10 像素和 5 像素。
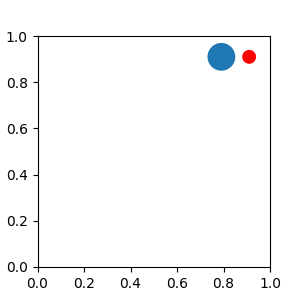
from matplotlib.patches import Circle
import matplotlib.pyplot as plt
from mpl_toolkits.axes_grid.anchored_artists import AnchoredDrawingArea

fig=plt.figure(1, figsize=(3,3))
ax = plt.subplot(111)


ada = AnchoredDrawingArea(40, 20, 0, 0,
                          loc=1, pad=0., frameon=False)
p1 = Circle((10, 10), 10)
ada.drawing_area.add_artist(p1)
p2 = Circle((30, 10), 5, fc="r")
ada.drawing_area.add_artist(p2)

ax.add_artist(ada)

plt.show()
有时,你想让你的艺术家按数据坐标(或其他坐标,而不是画布像素)缩放。 你可以使用AnchoredAuxTransformBox类。 这类似于AnchoredDrawingArea,除了艺术家的范围在绘制时由指定的变换确定。
from mpl_toolkits.axes_grid.anchored_artists import AnchoredAuxTransformBox

box = AnchoredAuxTransformBox(ax.transData, loc=2)
el = Ellipse((0,0), width=0.1, height=0.4, angle=30) # in data coordinates!
box.drawing_area.add_artist(el)
上述示例中的椭圆具有在数据坐标中对应于 0.1 和 0.4 的宽度和高度,并且当轴域的视图限制改变时将自动缩放。
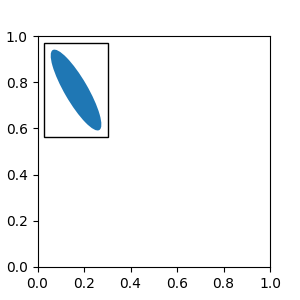
from matplotlib.patches import Ellipse
import matplotlib.pyplot as plt
from mpl_toolkits.axes_grid.anchored_artists import AnchoredAuxTransformBox

fig=plt.figure(1, figsize=(3,3))
ax = plt.subplot(111)

box = AnchoredAuxTransformBox(ax.transData, loc=2)
el = Ellipse((0,0), width=0.1, height=0.4, angle=30) # in data coordinates!
box.drawing_area.add_artist(el)

ax.add_artist(box)

plt.show()
如图例所示,可以设置bbox_to_anchor参数。 使用HPacker和VPacker,你可以像图例中一样排列艺术家(事实上,这是图例的创建方式)。
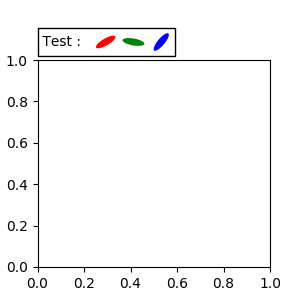
from matplotlib.patches import Ellipse
import matplotlib.pyplot as plt
from matplotlib.offsetbox import AnchoredOffsetbox, TextArea, DrawingArea, HPacker

fig=plt.figure(1, figsize=(3,3))
ax = plt.subplot(111)

box1 = TextArea(" Test : ", textprops=dict(color="k"))

box2 = DrawingArea(60, 20, 0, 0)
el1 = Ellipse((10, 10), width=16, height=5, angle=30, fc="r")
el2 = Ellipse((30, 10), width=16, height=5, angle=170, fc="g")
el3 = Ellipse((50, 10), width=16, height=5, angle=230, fc="b")
box2.add_artist(el1)
box2.add_artist(el2)
box2.add_artist(el3)


box = HPacker(children=[box1, box2],
              align="center",
              pad=0, sep=5)

anchored_box = AnchoredOffsetbox(loc=3,
                                 child=box, pad=0.,
                                 frameon=True,
                                 bbox_to_anchor=(0., 1.02),
                                 bbox_transform=ax.transAxes,
                                 borderpad=0.,
                                 )


ax.add_artist(anchored_box)

fig.subplots_adjust(top=0.8)
plt.show()
请注意,与图例不同,默认情况下,bbox_transform设置为IdentityTransform。
4.4 使用复杂坐标来标注
matplotlib 中的标注支持标注文本中描述的几种类型的坐标。 对于想要更多控制的高级用户,它支持几个其他选项。
1.Transform实例,例如:
ax.annotate("Test", xy=(0.5, 0.5), xycoords=ax.transAxes)
相当于:
ax.annotate("Test", xy=(0.5, 0.5), xycoords="axes fraction")
使用它,你可以在其他轴域内标注一个点:
ax1, ax2 = subplot(121), subplot(122)
ax2.annotate("Test", xy=(0.5, 0.5), xycoords=ax1.transData,
             xytext=(0.5, 0.5), textcoords=ax2.transData,
             arrowprops=dict(arrowstyle="->"))
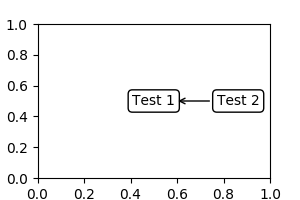
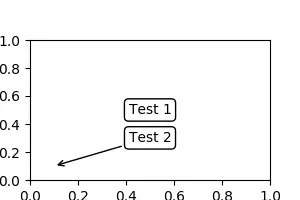
2.Artist实例。xy值(或xytext)被解释为艺术家的bbox(get_window_extent的返回值)的小数坐标。
an1 = ax.annotate("Test 1", xy=(0.5, 0.5), xycoords="data",
                  va="center", ha="center",
                  bbox=dict(boxstyle="round", fc="w"))
an2 = ax.annotate("Test 2", xy=(1, 0.5), xycoords=an1, # (1,0.5) of the an1's bbox
                  xytext=(30,0), textcoords="offset points",
                  va="center", ha="left",
                  bbox=dict(boxstyle="round", fc="w"),
                  arrowprops=dict(arrowstyle="->"))
import matplotlib.pyplot as plt

plt.figure(figsize=(3,2))
ax=plt.subplot(111)
an1 = ax.annotate("Test 1", xy=(0.5, 0.5), xycoords="data",
                  va="center", ha="center",
                  bbox=dict(boxstyle="round", fc="w"))
an2 = ax.annotate("Test 2", xy=(1, 0.5), xycoords=an1,
                  xytext=(30,0), textcoords="offset points",
                  va="center", ha="left",
                  bbox=dict(boxstyle="round", fc="w"),
                  arrowprops=dict(arrowstyle="->"))
plt.show()
请注意,你的责任是在绘制an2之前确定坐标艺术家(上例中的an1)的范围。 在大多数情况下,这意味着an2需要晚于an1。
3.一个返回BboxBase或Transform的实例的可调用对象。 如果返回一个变换,它与 1 相同,如果返回bbox,它与 2 相同。可调用对象应该接受renderer实例的单个参数。 例如,以下两个命令产生相同的结果:
an2 = ax.annotate("Test 2", xy=(1, 0.5), xycoords=an1,
                  xytext=(30,0), textcoords="offset points")
an2 = ax.annotate("Test 2", xy=(1, 0.5), xycoords=an1.get_window_extent,
                  xytext=(30,0), textcoords="offset points")
4.指定二元坐标的元组。 第一项用于x坐标,第二项用于y坐标。 例如, annotate(“Test”, xy=(0.5, 1), xycoords=(“data”, “axes fraction”))
0.5 的单位是数据坐标,1 的单位是归一化轴域坐标。 你可以像使用元组一样使用艺术家或变换。 例如, import matplotlib.pyplot as plt
plt.figure(figsize=(3,2))
ax=plt.axes([0.1, 0.1, 0.8, 0.7])
an1 = ax.annotate("Test 1", xy=(0.5, 0.5), xycoords="data",
                  va="center", ha="center",
                  bbox=dict(boxstyle="round", fc="w"))

an2 = ax.annotate("Test 2", xy=(0.5, 1.), xycoords=an1,
                  xytext=(0.5,1.1), textcoords=(an1, "axes fraction"),
                  va="bottom", ha="center",
                  bbox=dict(boxstyle="round", fc="w"),
                  arrowprops=dict(arrowstyle="->"))
plt.show()
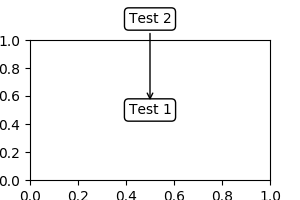
5.有时,您希望您的注释带有一些“偏移点”,不是距离注释点,而是距离某些其他点。 OffsetFrom是这种情况下的辅助类。
import matplotlib.pyplot as plt
plt.figure(figsize=(3,2)) ax=plt.axes([0.1, 0.1, 0.8, 0.7]) an1 = ax.annotate(“Test 1”, xy=(0.5, 0.5), xycoords=“data”, va=“center”, ha=“center”, bbox=dict(boxstyle=“round”, fc=“w”))
from matplotlib.text import OffsetFrom offset_from = OffsetFrom(an1, (0.5, 0)) an2 = ax.annotate(“Test 2”, xy=(0.1, 0.1), xycoords=“data”, xytext=(0, -10), textcoords=offset_from, # xytext is offset points from “xy=(0.5, 0), xycoords=an1” va=“top”, ha=“center”, bbox=dict(boxstyle=“round”, fc=“w”), arrowprops=dict(arrowstyle="->")) plt.show()
简书著作权归作者所有,任何形式的转载都请联系作者获得授权并注明出处。
4.6 使用ConnectorPatch
ConnectorPatch类似于没有文本的标注。 虽然在大多数情况下建议使用标注函数,但是当您想在不同的轴上连接点时,ConnectorPatch很有用。
from matplotlib.patches import ConnectionPatch
xy = (0.2, 0.2)
con = ConnectionPatch(xyA=xy, xyB=xy, coordsA="data", coordsB="data",
                      axesA=ax1, axesB=ax2)
ax2.add_artist(con)
上述代码连接了ax1中数据坐标的xy点,与ax2中数据坐标的xy点。这是个简单的例子。
虽然ConnectorPatch实例可以添加到任何轴,但您可能需要将其添加到绘图顺序中最新的轴,以防止与其他轴重叠。
五、高级话题
轴域之间的缩放效果
mpl_toolkits.axes_grid.inset_locator定义了一些补丁类,用于互连两个轴域。 理解代码需要一些 mpl 转换如何工作的知识。 但是,利用它的方式很直接。

from matplotlib.transforms import Bbox, TransformedBbox, \
    blended_transform_factory

from mpl_toolkits.axes_grid1.inset_locator import BboxPatch, BboxConnector,\
    BboxConnectorPatch


def connect_bbox(bbox1, bbox2,
                 loc1a, loc2a, loc1b, loc2b,
                 prop_lines, prop_patches=None):
    if prop_patches is None:
        prop_patches = prop_lines.copy()
        prop_patches["alpha"] = prop_patches.get("alpha", 1)*0.2

    c1 = BboxConnector(bbox1, bbox2, loc1=loc1a, loc2=loc2a, **prop_lines)
    c1.set_clip_on(False)
    c2 = BboxConnector(bbox1, bbox2, loc1=loc1b, loc2=loc2b, **prop_lines)
    c2.set_clip_on(False)

    bbox_patch1 = BboxPatch(bbox1, **prop_patches)
    bbox_patch2 = BboxPatch(bbox2, **prop_patches)

    p = BboxConnectorPatch(bbox1, bbox2,
                           # loc1a=3, loc2a=2, loc1b=4, loc2b=1,
                           loc1a=loc1a, loc2a=loc2a, loc1b=loc1b, loc2b=loc2b,
                           **prop_patches)
    p.set_clip_on(False)

    return c1, c2, bbox_patch1, bbox_patch2, p


def zoom_effect01(ax1, ax2, xmin, xmax, **kwargs):
    """
    ax1 : the main axes
    ax1 : the zoomed axes
    (xmin,xmax) : the limits of the colored area in both plot axes.

    connect ax1 & ax2. The x-range of (xmin, xmax) in both axes will
    be marked.  The keywords parameters will be used ti create
    patches.

    """

    trans1 = blended_transform_factory(ax1.transData, ax1.transAxes)
    trans2 = blended_transform_factory(ax2.transData, ax2.transAxes)

    bbox = Bbox.from_extents(xmin, 0, xmax, 1)

    mybbox1 = TransformedBbox(bbox, trans1)
    mybbox2 = TransformedBbox(bbox, trans2)

    prop_patches = kwargs.copy()
    prop_patches["ec"] = "none"
    prop_patches["alpha"] = 0.2

    c1, c2, bbox_patch1, bbox_patch2, p = \
        connect_bbox(mybbox1, mybbox2,
                     loc1a=3, loc2a=2, loc1b=4, loc2b=1,
                     prop_lines=kwargs, prop_patches=prop_patches)

    ax1.add_patch(bbox_patch1)
    ax2.add_patch(bbox_patch2)
    ax2.add_patch(c1)
    ax2.add_patch(c2)
    ax2.add_patch(p)

    return c1, c2, bbox_patch1, bbox_patch2, p


def zoom_effect02(ax1, ax2, **kwargs):
    """
    ax1 : the main axes
    ax1 : the zoomed axes

    Similar to zoom_effect01.  The xmin & xmax will be taken from the
    ax1.viewLim.
    """

    tt = ax1.transScale + (ax1.transLimits + ax2.transAxes)
    trans = blended_transform_factory(ax2.transData, tt)

    mybbox1 = ax1.bbox
    mybbox2 = TransformedBbox(ax1.viewLim, trans)

    prop_patches = kwargs.copy()
    prop_patches["ec"] = "none"
    prop_patches["alpha"] = 0.2

    c1, c2, bbox_patch1, bbox_patch2, p = \
        connect_bbox(mybbox1, mybbox2,
                     loc1a=3, loc2a=2, loc1b=4, loc2b=1,
                     prop_lines=kwargs, prop_patches=prop_patches)

    ax1.add_patch(bbox_patch1)
    ax2.add_patch(bbox_patch2)
    ax2.add_patch(c1)
    ax2.add_patch(c2)
    ax2.add_patch(p)

    return c1, c2, bbox_patch1, bbox_patch2, p


import matplotlib.pyplot as plt

plt.figure(1, figsize=(5, 5))
ax1 = plt.subplot(221)
ax2 = plt.subplot(212)
ax2.set_xlim(0, 1)
ax2.set_xlim(0, 5)
zoom_effect01(ax1, ax2, 0.2, 0.8)


ax1 = plt.subplot(222)
ax1.set_xlim(2, 3)
ax2.set_xlim(0, 5)
zoom_effect02(ax1, ax2)

plt.show()
5.2 定义自定义盒样式
你可以使用自定义盒样式,boxstyle的值可以为如下形式的可调用对象:
def __call__(self, x0, y0, width, height, mutation_size,
             aspect_ratio=1.):
    """
    Given the location and size of the box, return the path of
    the box around it.

      - *x0*, *y0*, *width*, *height* : location and size of the box
      - *mutation_size* : a reference scale for the mutation.
      - *aspect_ratio* : aspect-ratio for the mutation.
    """
    path = ...
    return path
这里是个复杂的例子:
from matplotlib.path import Path

def custom_box_style(x0, y0, width, height, mutation_size, mutation_aspect=1):
    """
    Given the location and size of the box, return the path of
    the box around it.

     - *x0*, *y0*, *width*, *height* : location and size of the box
     - *mutation_size* : a reference scale for the mutation.
     - *aspect_ratio* : aspect-ration for the mutation.
    """

    # note that we are ignoring mutation_aspect. This is okay in general.

    # padding
    mypad = 0.3
    pad = mutation_size * mypad

    # width and height with padding added.
    width, height = width + 2.*pad, \
                    height + 2.*pad,

    # boundary of the padded box
    x0, y0 = x0-pad, y0-pad,
    x1, y1 = x0+width, y0 + height

    cp = [(x0, y0),
          (x1, y0), (x1, y1), (x0, y1),
          (x0-pad, (y0+y1)/2.), (x0, y0),
          (x0, y0)]

    com = [Path.MOVETO,
           Path.LINETO, Path.LINETO, Path.LINETO,
           Path.LINETO, Path.LINETO,
           Path.CLOSEPOLY]

    path = Path(cp, com)

    return path


import matplotlib.pyplot as plt

plt.figure(1, figsize=(3,3))
ax = plt.subplot(111)
ax.text(0.5, 0.5, "Test", size=30, va="center", ha="center",
        bbox=dict(boxstyle=custom_box_style, alpha=0.2))
但是,推荐你从matplotlib.patches.BoxStyle._Base派生,像这样:
from matplotlib.path import Path
from matplotlib.patches import BoxStyle
import matplotlib.pyplot as plt

# we may derive from matplotlib.patches.BoxStyle._Base class.
# You need to override transmute method in this case.

class MyStyle(BoxStyle._Base):
    """
    A simple box.
    """

    def __init__(self, pad=0.3):
        """
        The arguments need to be floating numbers and need to have
        default values.

         *pad*
            amount of padding
        """

        self.pad = pad
        super(MyStyle, self).__init__()

    def transmute(self, x0, y0, width, height, mutation_size):
        """
        Given the location and size of the box, return the path of
        the box around it.

         - *x0*, *y0*, *width*, *height* : location and size of the box
         - *mutation_size* : a reference scale for the mutation.

        Often, the *mutation_size* is the font size of the text.
        You don't need to worry about the rotation as it is
        automatically taken care of.
        """

        # padding
        pad = mutation_size * self.pad

        # width and height with padding added.
        width, height = width + 2.*pad, \
                        height + 2.*pad,

        # boundary of the padded box
        x0, y0 = x0-pad, y0-pad,
        x1, y1 = x0+width, y0 + height

        cp = [(x0, y0),
              (x1, y0), (x1, y1), (x0, y1),
              (x0-pad, (y0+y1)/2.), (x0, y0),
              (x0, y0)]

        com = [Path.MOVETO,
               Path.LINETO, Path.LINETO, Path.LINETO,
               Path.LINETO, Path.LINETO,
               Path.CLOSEPOLY]

        path = Path(cp, com)

        return path


# register the custom style
BoxStyle._style_list["angled"] = MyStyle

plt.figure(1, figsize=(3,3))
ax = plt.subplot(111)
ax.text(0.5, 0.5, "Test", size=30, va="center", ha="center", rotation=30,
        bbox=dict(boxstyle="angled,pad=0.5", alpha=0.2))

del BoxStyle._style_list["angled"]

plt.show()
与之类似,您可以定义一个自定义的ConnectionStyle和一个自定义的ArrowStyle。 请参阅lib/matplotlib/patches.py的源代码,并查看每个样式类是如何定义的。

from matplotlib.path import Path
from matplotlib.patches import BoxStyle
import matplotlib.pyplot as plt

# we may derive from matplotlib.patches.BoxStyle._Base class.
# You need to override transmute method in this case.

class MyStyle(BoxStyle._Base):
    """
    A simple box.
    """

    def __init__(self, pad=0.3):
        """
        The arguments need to be floating numbers and need to have
        default values.

         *pad*
            amount of padding
        """

        self.pad = pad
        super(MyStyle, self).__init__()

    def transmute(self, x0, y0, width, height, mutation_size):
        """
        Given the location and size of the box, return the path of
        the box around it.

         - *x0*, *y0*, *width*, *height* : location and size of the box
         - *mutation_size* : a reference scale for the mutation.

        Often, the *mutation_size* is the font size of the text.
        You don't need to worry about the rotation as it is
        automatically taken care of.
        """

        # padding
        pad = mutation_size * self.pad

        # width and height with padding added.
        width, height = width + 2.*pad, \
                        height + 2.*pad,

        # boundary of the padded box
        x0, y0 = x0-pad, y0-pad,
        x1, y1 = x0+width, y0 + height

        cp = [(x0, y0),
              (x1, y0), (x1, y1), (x0, y1),
              (x0-pad, (y0+y1)/2.), (x0, y0),
              (x0, y0)]

        com = [Path.MOVETO,
               Path.LINETO, Path.LINETO, Path.LINETO,
               Path.LINETO, Path.LINETO,
               Path.CLOSEPOLY]

        path = Path(cp, com)

        return path


# register the custom style
BoxStyle._style_list["angled"] = MyStyle

plt.figure(1, figsize=(3,3))
ax = plt.subplot(111)
ax.text(0.5, 0.5, "Test", size=30, va="center", ha="center", rotation=30,
        bbox=dict(boxstyle="angled,pad=0.5", alpha=0.2))

del BoxStyle._style_list["angled"]

plt.show()
参考资料
