【3.6】matplotlib-坐标轴axis(ticks,label)
二维的轴(axis)分成xaxis和yaxis,其分别都包含tick和tick label。
一、函数定义
1.1 坐标轴设置
主要用于设置坐标轴的属性,返回值为当前的坐标轴范围 [xmin, xmax, ymin, ymax],几种调用方式如下:
plt.axis(*v, **kwargs)
| 调用方式 | 说明 |
|---|---|
| axis() | 返回当前的坐标轴范围 [xmin, xmax, ymin, ymax] |
| axis(v) | 其中 v 为 [xmin, xmax, ymin, ymax]用来设置坐标轴范围 |
| axis(‘off’) | 不显示坐标轴和坐标轴名称 |
| axis(‘equal’) | x、y 轴对应长度所表示的数值相同,提高某一个轴的范围以保持图表大小及比例不变 |
| axis(‘scaled’) | x、y 轴对应长度所表达的数值相同,并保持两个轴的数值范围不变,因此需要对图表比例进行调整(缩放) |
| axis(‘tight’) | 在显示所有数据的前提下,尽量减少两个轴的数值范围,并尽量让数据居中 |
| axis(‘image’) | 将图表比例按照图片的比例进行调整(缩放) |
| axis(‘square’) | 将图表变成正方形,并确保 (xmax-xmin) 与 (ymax-ymin) 相同 |
| axis(‘auto’) | 恢复自动范围 |
1.2 ticks
xticks返回的是Text对象,那我们就可以去看matplotlib.text.Text都包含了哪些参数,可以通过get_来获得对应的属性,通过set_来修改其对应的属性
函数位置
matplotlib.pyplot.xticks(ticks=None, labels=None, **kwargs)
一般 用法:
locs, labels = xticks()           # Get locations and labels
xticks(ticks, [labels], **kwargs)  # Set locations and labels
参数:
ticks : array_like
A list of positions at which ticks should be placed. You can pass an empty list to disable xticks.

labels : array_like, optional
A list of explicit labels to place at the given locs.

**kwargs
Text properties can be used to control the appearance of the labels.
返回:
locs : An array of label locations.
labels :A list of Text objects.
二、常用例子
2.1 获得当前的locs和labels
>>> locs, labels = xticks()
获取label 的名字和坐标
fig, axs = plt.subplots(2,1,figsize=(22,10))
ax = axs[0]
bar_labels = ax.get_xticklabels()
bar_locs = ax.get_xticks()

for bar_loc,one_bar in zip(bar_locs,bar_labels):
    bar_loc = int(bar_loc)
    bar_codon = one_bar._text
2.2 设置label的位置
>>> xticks(np.arange(0, 1, step=0.2))
2.3 设置text labels
>>> xticks(np.arange(5), ('Tom', 'Dick', 'Harry', 'Sally', 'Sue'))
2.4 设置labels和属性
>>> xticks(np.arange(12), calendar.month_name[1:13], rotation=20)
2.5 关闭xticks
xticks([])

#如果是子图,则
ax2.set_xticklabels([])
关闭/打开当前图表的次坐标
plt.minorticks_off() 和 plt.minorticks_on()
是否自动设置坐标轴的范围:
plt.autoscale(enable=True, axis='both')

axis 可选 x、y、both
2.6 ticks旋转90度
方法一:
plt.xticks(rotation=90)
方法二:
调整x轴标签,从垂直变成水平或者任何你想要的角度,只需要改变rotation的数值。 (我更常用这个命令,如果不想改label的名字,用这个方法就行)
for tick in ax1.get_xticklabels():
    tick.set_rotation(360)
2.7 修改ticks字体大小
全局修改
plt.rc('xtick', labelsize=6)
plt.rc('ytick', labelsize=6)
部分修改
ax.xaxis.set_tick_params(labelsize=20)
部分修改(需要指定ax1 label)
ax1.set_xticklabels(ax1_x, fontsize=15)
比较好用的方案
import matplotlib.pyplot as plt
# We prepare the plot
fig = plt.figure(1)
# We define a fake subplot that is in fact only the plot.
ax = fig.add_subplot(111)

# We change the fontsize of minor ticks label
ax.tick_params(axis='both', which='major', labelsize=10)
ax.tick_params(axis='both', which='minor', labelsize=8)
2.8 ticks内嵌
import matplotlib.pyplot as plt

fig, ax = plt.subplots()
ax.tick_params(axis="y",direction="in", pad=-22)
ax.tick_params(axis="x",direction="in", pad=-15)

plt.show()

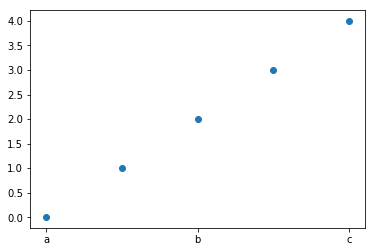
2.9 子图设置ticks
1.Use the axes methods of the subplot object (e.g. ax.set_xticks and ax.set_xticklabels) or
import matplotlib.pyplot as plt
x = range(5)
y = range(5)
fig = plt.figure()
ax = fig.add_subplot(111)
ax.scatter(x,y)
ax.set_xticks([0,2,4])
ax.set_xticklabels(['a','b','c'],rotation=45)  #替换ticks,然后旋转ticks
plt.show()
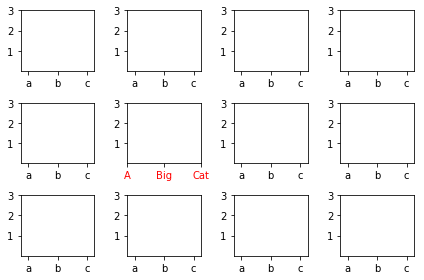
2.Use plt.sca to set the current axes for the pyplot state machine (i.e. the plt interface).
import matplotlib.pyplot as plt

fig, axes = plt.subplots(nrows=3, ncols=4)

# Set the ticks and ticklabels for all axes
plt.setp(axes, xticks=[0.1, 0.5, 0.9], xticklabels=['a', 'b', 'c'],
        yticks=[1, 2, 3])

# Use the pyplot interface to change just one subplot...
plt.sca(axes[1, 1])
plt.xticks(range(3), ['A', 'Big', 'Cat'], color='red')

fig.tight_layout()
plt.show()
2.10 修改部分label的颜色
import matplotlib.pyplot as plt

fig, ax = plt.subplots(figsize=(5,4))
ax.plot([1,2,3])

plt.xticks([0.5,1,2,1.5,3],[0.5,1,2,1.5,3])
mark_red_list = ['0.5','1.5']
# mark_red_list = []
for ii in range(len(ax.get_xticklabels())):
    one_label = ax.get_xticklabels()[ii].get_text()
    if one_label in mark_red_list:
        ax.get_xticklabels()[ii].set_color("red")

plt.show()

其他属性同理
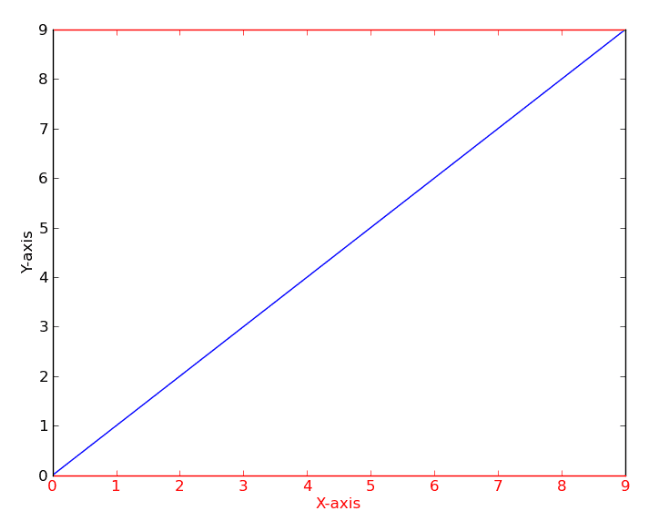
2.11 修改其他颜色
import matplotlib.pyplot as plt

fig = plt.figure()
ax = fig.add_subplot(111)

ax.plot(range(10))
ax.set_xlabel('X-axis')
ax.set_ylabel('Y-axis')

ax.spines['bottom'].set_color('red')
ax.spines['top'].set_color('red')
ax.xaxis.label.set_color('red')
ax.tick_params(axis='x', colors='red')

plt.show()
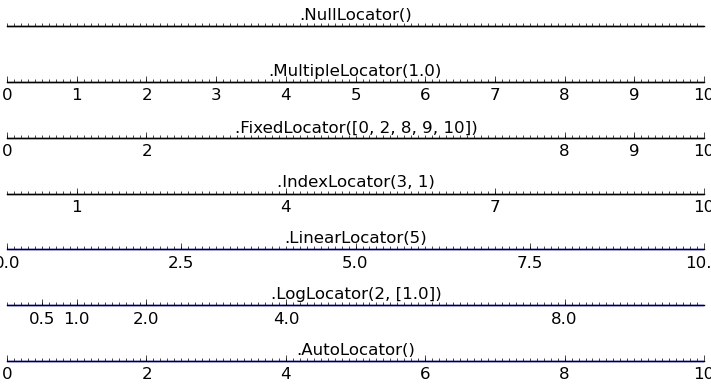
2.11 Tick Locators
Tick Locators 控制着 ticks 的位置。比如下面:
ax = plt.gca()
ax.xaxis.set_major_locator(eval(locator))
一些不同类型的locators:
代码如下:
import numpy as np
import matplotlib.pyplot as plt


def tickline():
	plt.xlim(0, 10), plt.ylim(-1, 1), plt.yticks([])
	ax = plt.gca()
	ax.spines['right'].set_color('none')
	ax.spines['left'].set_color('none')
	ax.spines['top'].set_color('none')
	ax.xaxis.set_ticks_position('bottom')
	ax.spines['bottom'].set_position(('data',0))
	ax.yaxis.set_ticks_position('none')
	ax.xaxis.set_minor_locator(plt.MultipleLocator(0.1))
	ax.plot(np.arange(11), np.zeros(11))
	return ax

locators = [
'plt.NullLocator()',
'plt.MultipleLocator(1.0)',
'plt.FixedLocator([0, 2, 8, 9, 10])',
'plt.IndexLocator(3, 1)',
'plt.LinearLocator(5)',
'plt.LogLocator(2, [1.0])',
'plt.AutoLocator()',
]

n_locators = len(locators)

size = 512, 40 * n_locators
dpi = 72.0
figsize = size[0] / float(dpi), size[1] / float(dpi)
fig = plt.figure(figsize=figsize, dpi=dpi)
fig.patch.set_alpha(0)


for i, locator in enumerate(locators):
	plt.subplot(n_locators, 1, i + 1)
	ax = tickline()
	ax.xaxis.set_major_locator(eval(locator))
	plt.text(5, 0.3, locator[3:], ha='center')

plt.subplots_adjust(bottom=.01, top=.99, left=.01, right=.99,hspace=0.2)  # 给ticks和labels预留空间;hspace 代表子图之间的距离

plt.show()
所有这些locators均来自于基类matplotlib.ticker.Locator。你可以通过继承该基类创建属于自己的locator样式。同时matplotlib也提供了特殊的日期locator, 位于matplotlib.dates.
2.12 修改字体
方法一:
ax1.set_xticklabels(real_x_ticks,rotation=90, fontname='monospace')
方法二:
fp = FontProperties(fname='/data/software/font/arial/Arial_bold.ttf',size=40)
ax1.set_xticklabels(real_x_ticks,rotation=90, fontproperties=fp)
2.13 限制x轴和y轴的范围
plt.xlim() 和 plt.ylim()
设置并返回 x 轴和 y 轴的数值范围,以 xlim() 为例说明调用方式:
| 调用方式 | 说明 |
|---|---|
| xlim() | 返回 xmin, xmax |
| xlim(xmin, xmax) 或 xlim((xmin, xmax)) | 设置 x 轴的最大、最小值 |
| xlim(xmax = n) 和 xlim(xmin = n) | 设置 x 轴的最大或最小值 |
2.14 scale标签刻度
plt.xscale(scale, **kwargs) 和 plt.yscale(scale, **kwargs)
设置 x 轴及 y 轴的缩放方式,参数如下:
‘linear’: 线性
‘log’: 指数类型,支持的 kwargs 包括:
basex/basey: 指数的底
nonposx/nonposy: 如何处理负数,直接截掉(‘mask’)还是化成一个接近 0 的数(‘clip’)
subx/suby: 需要是一个整数构成的数组,用于确定坐标轴上 subtick 的位置
‘logit’: 评定模型,支持的 kwargs 包括:
nonpos: 对于大于 1 或小于 0 的数据如何处理,直接截掉(‘mask’)或化成一个接近 1 或 0 的数(‘clip’)
‘symlog’: 对数类型,支持的 kwargs 包括:
basex/basey: 对数的底
linthreshx/linthreshy: 在 (-x, x) 范围内采用线性方式
subx/suby: 需要是一个整数构成的数组,用于确定坐标轴上 subtick 的位置
对坐标轴Log
plt.xscale('log')
2.15 坐标轴反转
plt.gca().invert_xaxis()
plt.gca().invert_yaxis()
参考资料
- https://matplotlib.org/api/_as_gen/matplotlib.pyplot.xticks.html
- https://stackoverflow.com/questions/19626530/python-xticks-in-subplots
- https://stackoverflow.com/questions/47873389/matplotlib-move-tick-labels-inside-plot-area
- https://stackoverflow.com/questions/6390393/matplotlib-make-tick-labels-font-size-smaller
