【4.1】一页多图
ggplot2 的分面(facet_grid(~bq))可以绘制一页多图, 但是必须是来自同一个数据集的图形,局限性很大. 如果我们有多个不同来源的图形,想绘制到一张图上又该如何处理呢? multiplot提供了极为强大的函数功能.
# Multiple plot function
#
# ggplot objects can be passed in ..., or to plotlist (as a list of ggplot objects)
# - cols:   Number of columns in layout
# - layout: A matrix specifying the layout. If present, 'cols' is ignored.
#
# If the layout is something like matrix(c(1,2,3,3), nrow=2, byrow=TRUE),
# then plot 1 will go in the upper left, 2 will go in the upper right, and
# 3 will go all the way across the bottom.
#
multiplot <- function(..., plotlist=NULL, file, cols=1, layout=NULL) {
	library(grid)

	# Make a list from the ... arguments and plotlist
	plots <- c(list(...), plotlist)

	numPlots = length(plots)

	# If layout is NULL, then use 'cols' to determine layout
	if (is.null(layout)) {
		# Make the panel
		# ncol: Number of columns of plots
		# nrow: Number of rows needed, calculated from # of cols
		layout <- matrix(seq(1, cols * ceiling(numPlots/cols)),
										ncol = cols, nrow = ceiling(numPlots/cols))
	}

 if (numPlots==1) {
		print(plots[[1]])

	} else {
		# Set up the page
		grid.newpage()
		pushViewport(viewport(layout = grid.layout(nrow(layout), ncol(layout))))

		# Make each plot, in the correct location
		for (i in 1:numPlots) {
			# Get the i,j matrix positions of the regions that contain this subplot
			matchidx <- as.data.frame(which(layout == i, arr.ind = TRUE))

			print(plots[[i]], vp = viewport(layout.pos.row = matchidx$row,

																layout.pos.col = matchidx$col))
			}
	}
}
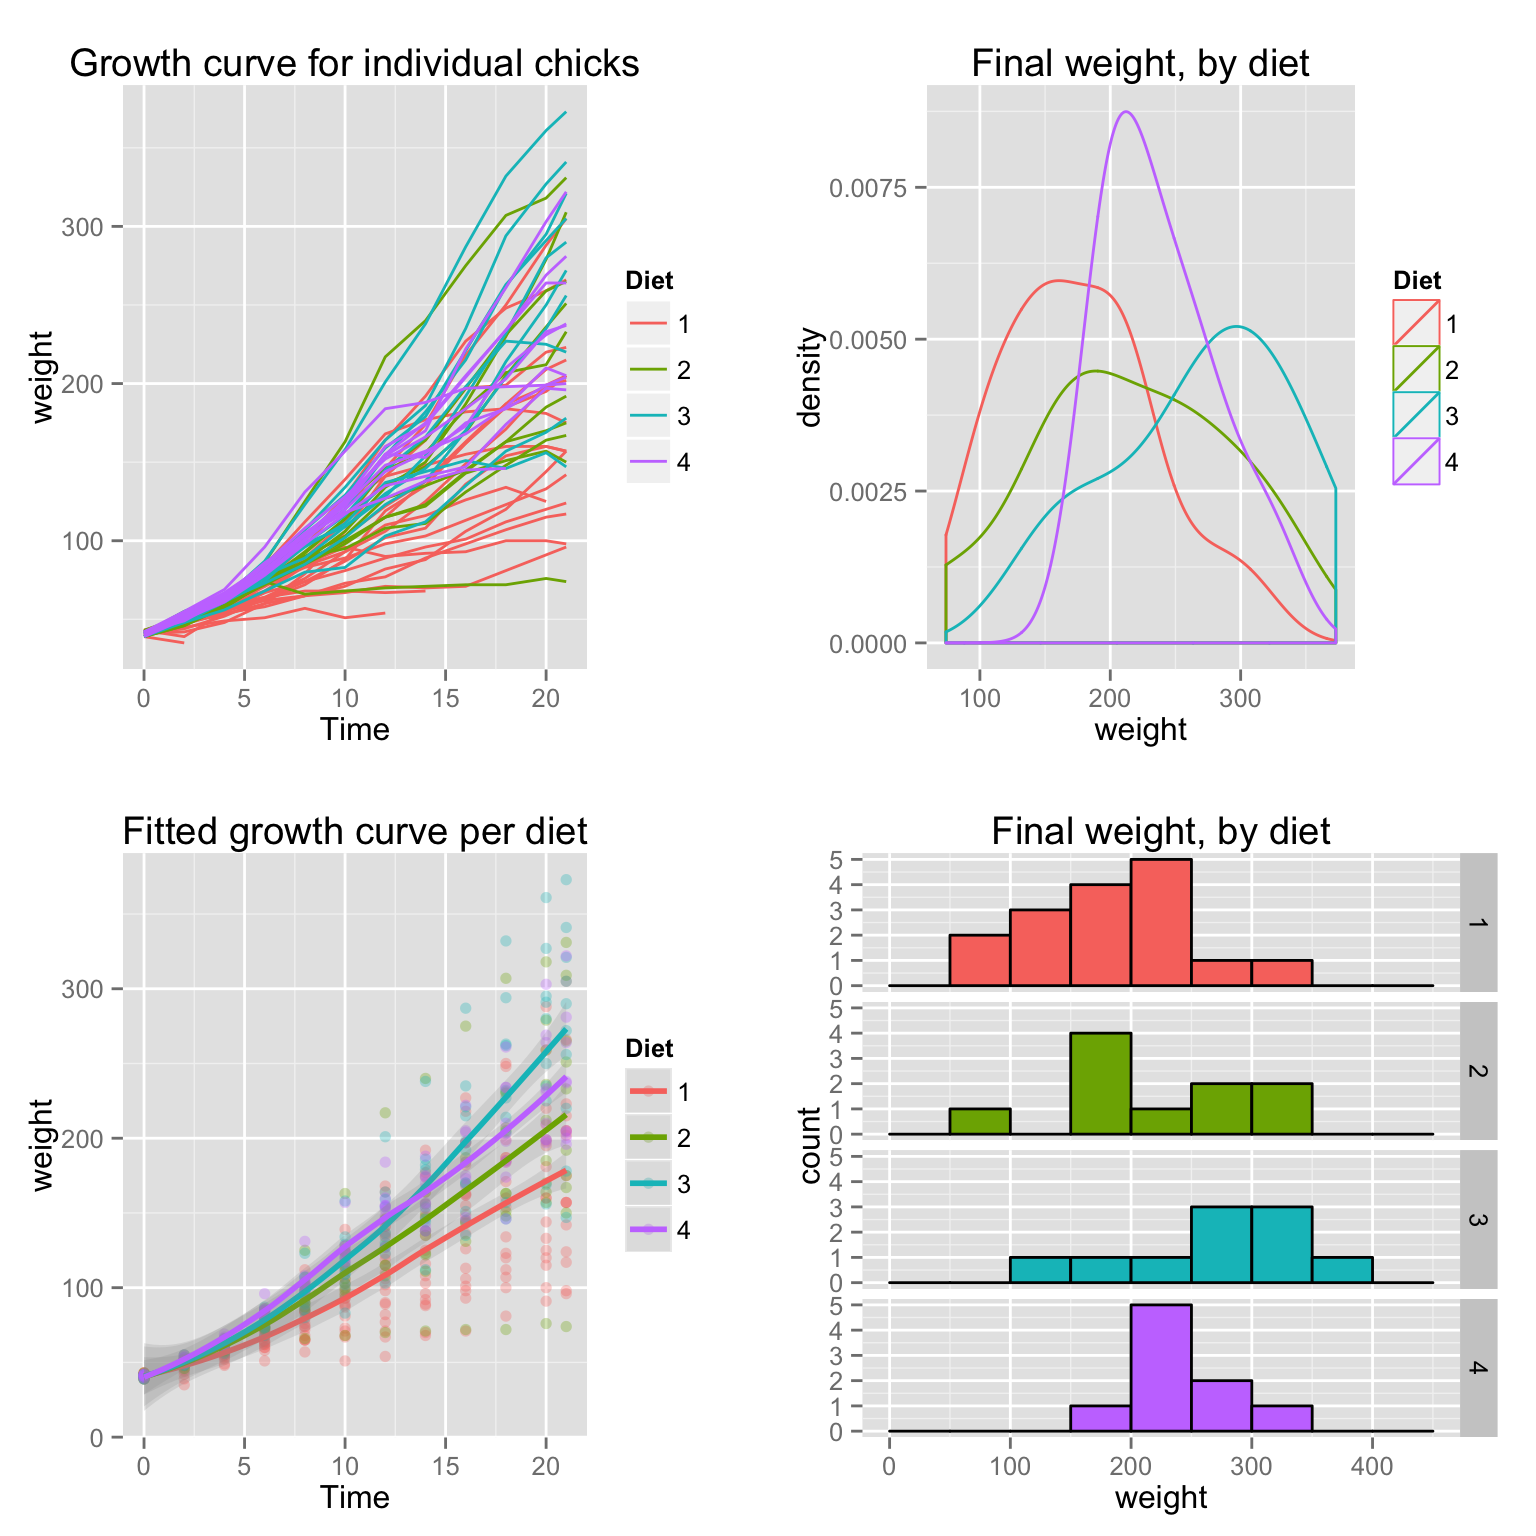
示 library(ggplot2) # This example uses the ChickWeight dataset, which comes with ggpl
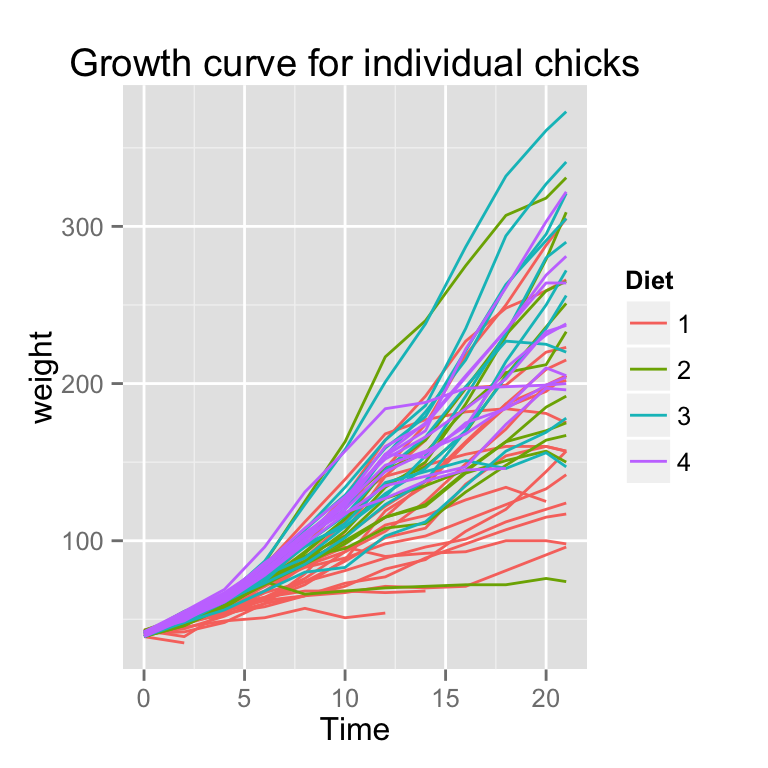
#图1
p1 <- ggplot(ChickWeight, aes(x=Time, y=weight, colour=Diet, group=Chck))+geom_line() +ggtitle("Growth curve for individual chicks")
p1
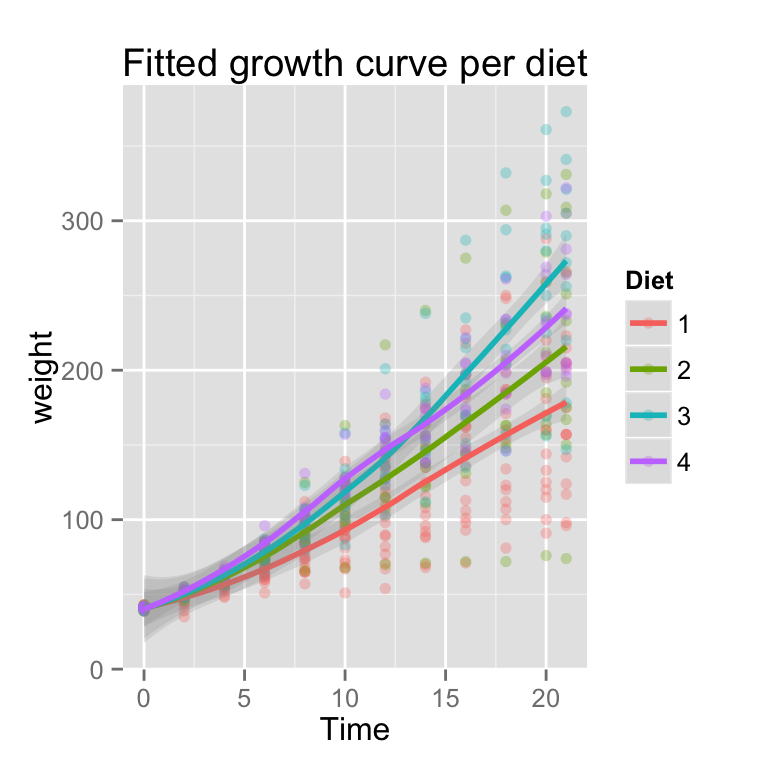
p2 <- ggplot(ChickWeight, aes(x=Time, y=weight, colour=Diet)) +
		geom_point(alpha=.3) +
		geom_smooth(alpha=.2, size=1) 			ggtitle("Fitted growth curve per diet")
p2
## geom_smooth: method="auto" and size of largest group is <1000, so using loess. Use 'method = x' to change the smoothing method.
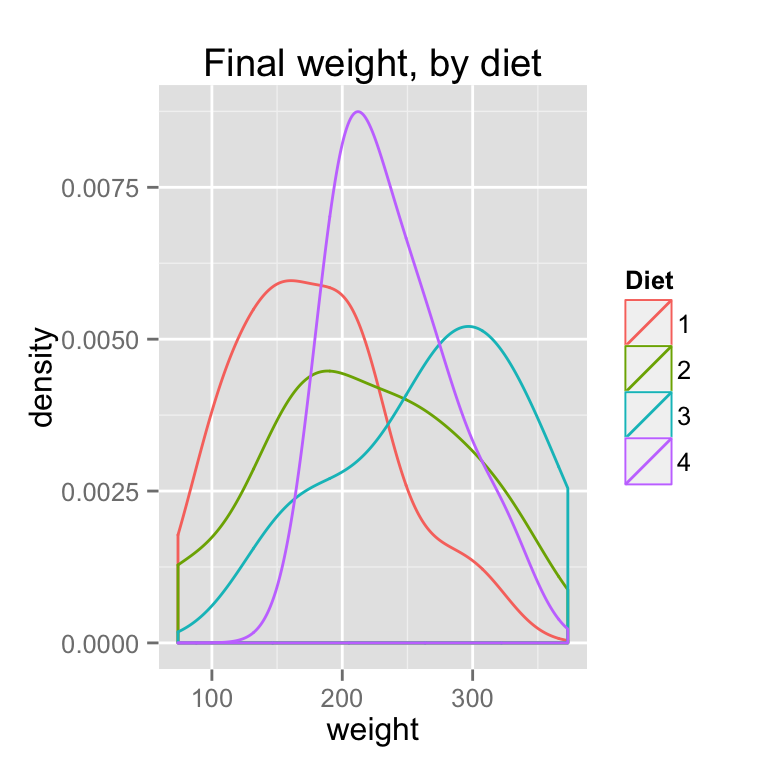
#图3
p3 - ggplot(subset(ChickWeight, Time==21), aes(x=weight, colour=Diet)) 				geom_density() +
			ggtitle("Final weight, by diet")
	p3
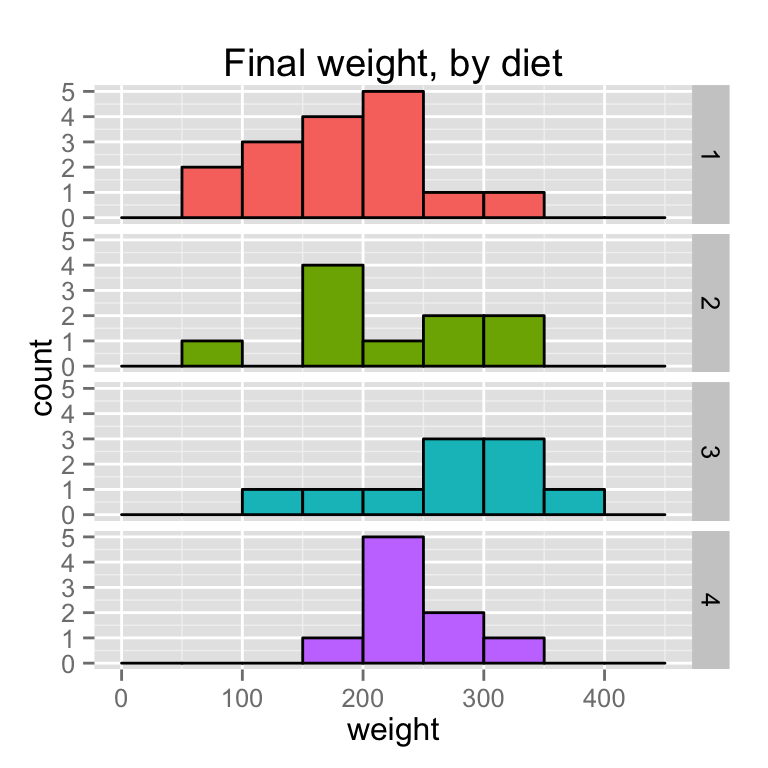
#图4
p4 <- ggplot(subset(ChickWeight, Time==21), aes(x=weight, fill=Diet)) +
			geom_histogram(colour="bla, binwidth=50) +
			facet_grid(Diet ~ .) +
	ggtitle("Final weight, by die") 				theme(legend.position="none")        # No legend (redundant in this graph)
合并为一张图
	multiplot(p1, p2, p3, p4, cols=2)
	## geom_smooth: method="auto" and size of largest group is <1000, so using loess. Use 'method = x' to change the smoothing method.
问题:
- ggplot 的PDF格式的输出字体有变化
- 需要调节pdf这个参数字体的比例
- 包括三个系数:width,height,pointsize
参考资料:
药企,独角兽,苏州。团队长期招人,感兴趣的都可以发邮件聊聊:tiehan@sina.cn
![]() 个人公众号,比较懒,很少更新,可以在上面提问题,如果回复不及时,可发邮件给我: tiehan@sina.cn
个人公众号,比较懒,很少更新,可以在上面提问题,如果回复不及时,可发邮件给我: tiehan@sina.cn
