【1.1】heatmap
R以及R-studio的安装前面的博文中已经交代了,之前看了Robert l著的R语言实践,一直没有机会操作,没想到拿R操作的第一张图就是heatmap,爽啊。
A heat map is a graphical representation of data where the values taken by a variable in a two-dimensional map are represented as colors.Heat maps originated in 2D displays of the values in a data matrix. Larger values were represented by small dark gray or black squares (pixels) and smaller values by lighter squares.例1:
首先调用程序包gplots
library(gplots)
1,将我的excel表格另存为csv格式,读取文件,并命名为ge
ge<-read.csv("/文件所在目录/**.csv",sep=",")
2,排序
ge<-ge[order(ge$m),] #m为需要排序的那一列的列名,也可以是其他的列的第一列
3,把行号换成行名
row.names(ge)<-ge$n #n为第一列的列名,也就是第一列第一行的那个字符
去掉第一列行号: ge <- ge[,-1]
4,把 data frame 转化为我们需要的矩阵格式
ge_matrix <- data.matrix(ge)
5,绘制heatmap
heatmap.2(ge_matrix,Rowv=NA,Colv=NA,dendrogram=('none'), distfun=dist, hclustfun=hclust,col=cm.colors(256),keysize=1.5,margins=c(5,10),density.info=c('none'),
trace="none",vline=NA,hline=NA,main=c('otu分类'),ylab=c('otu'),xlab=c('enzyme')
例二:
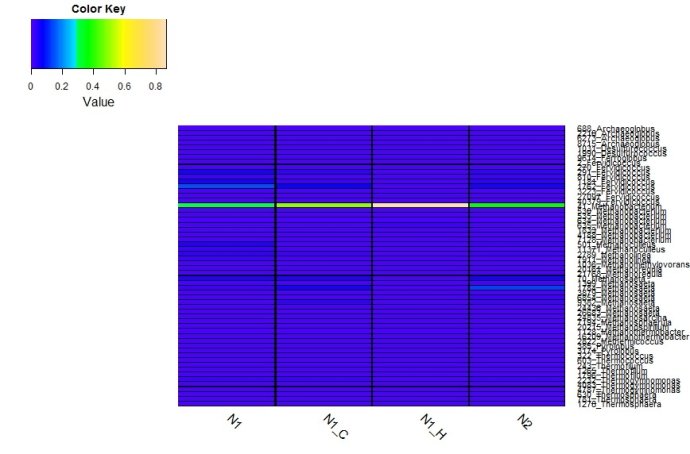
## arc_otu.txt数据所在的位置 http://pan.baidu.com/s/1mgNwlW8
ge<-read.table('arc_otu.txt',sep=" ",header=T)
ge2<-ge[,c(2:5)] #仅仅取里面少部分数据
row.names(ge2)<-ge$haha
ge_matrix <- data.matrix(ge2)
library(gplots);
heatmap.2(ge_matrix,Rowv=NA,Colv=NA,dendrogram=('none'),distfun=dist, hclustfun=hclust,col=topo.colors(75),keysize=1.5,margins=c(5,10),density.info=c('none'),
trace="none",vline=NA,hline=NA,cexRow=0.8,cexCol=1.1,colsep=c(1:ncol(ge_matrix)),
rowsep=c(1:nrow(ge_matrix)),sepcolor="black",sepwidth=c(0.01, 0.01),srtCol=315,adjCol=c(0,0))
参数详解
#Rowv=NA,Colv=NA,dendrogram=('none')决定是否根据行或列的平均值来聚类
# col=redgreen(75)是颜色的选择,
heat.colors()从红色渐变到黄色再变到白色(以体现“高温”、“白热化”)。
terrain.colors()从绿色渐变到黄色再到棕色最后到白色(这些颜色适合表示地理地形)。
cm.colors()从青色渐变到白色再到粉红色。
topo.colors()从蓝色渐变到青色再到黄色最后到棕色。
#keysize=1.5 调整的是颜色标签的大小,density.info=c('none')键值是否显示波动信息
#margins=c(5,10) heatmap这个图预留给横纵坐标的位置大小,数值越大,留给行名或者列名的空间越大,可以试一下,就知道了。
# trace="none",vline=NA,hline=NA 具体什么意思 还是不清楚
# cexRow=0.8,cexCol=1.1调整行或列字体的大小
# colsep=c(1:ncol(ge_matrix)),rowsep=c(1:nrow(ge_matrix)),sepcolor="black",sepwidth=c(0.01, 0.01) 每个点做一下分界线
#如果字体太长,或者字体太密集,有如下方法可以调整:
1改变字体大小
cexRow=0.8,cexCol=1.1
2多预留字体空间margins=c(5,10)
3改变字体的角度
srtCol=315,adjCol=c(0,1) 调整列的名字的角度 srtCol 表示列名顺时针旋转的角度,adjCol调整的应该是列名,第二个反映数值大小反映的是名字离图形的距离,值越小,离图越近,第一个值给我的感觉好像是反映名字的一个弧度的变化
srtCol=45,adjRow=c(0,1) 调整行的名字的角度
4调整字体与图的距离
offsetRow=-1, offsetCol=-1 默认的是0吧,数值越大,离的越远
通过eample(heatmap.2)可以看到变化
调整键值的位置:
lmat, lhei和lwid影响heatmap作图的布局
默认情况下,该图由四个部分组成,数字代表了该部分
1,Heatmap,
2,Row dendrogram,
3,Column dendrogram,
4,Ke
默认的布局为
>rbind(4:3,2:1)
[,1] [,2]
[1,] 4 3
[2,] 2 1
所以我们看到的图是左上角是键值,右上角是列的聚类,左下角是行的聚类,右下角是热电图
如果你想把键值放在图下面:可以这样
> lmat = rbind(c(0,3),c(2,1),c(0,4))
> lmat
[,1] [,2]
[1,] 0 3
[2,] 2 1
[3,] 0 4
lwid和lhei分别指示行和列,默认是两者默认的都是c(1.5,4)
如果你修改者四个部分的位置,你还得修改相应部分的比例
>lwid = c(1.5,4)
>lhei = c(1.5,4,1)
现在是想把键值放在右边,同时取消行和列的聚类
>lmat =rbind(c(0,3,0),c(2,1,4)),lwid = c(0.5,4,0.5),lhei = c(0.5,4)
#heatmap各个参数的意思(分为了如下几个模块)
heatmap.2 (x,
# dendrogram control 是否聚类分析
Rowv = TRUE,
Colv=if(symm)"Rowv" else TRUE,
distfun = dist,
hclustfun = hclust,
dendrogram = c("both","row","column","none"),
symm = FALSE,

# data scaling 是否处理数据
scale = c("none","row", "column"), #标注化行或者列
na.rm=TRUE,

# image plot
revC = identical(Colv, "Rowv"),
add.expr,

# mapping data to colors
breaks,
symbreaks=min(x < 0, na.rm=TRUE) || scale!="none",

# colors
col="heat.colors",

	# block sepration
#数据中的每个点对应Heatmap中的每个小块,小块与小块之间是否加上分割的标记
colsep,
rowsep,
sepcolor="white",
sepwidth=c(0.05,0.05),

# cell labeling
cellnote,
notecex=1.0,
notecol="cyan",
na.color=par("bg"),

# level trace
trace=c("column","row","both","none"),
tracecol="cyan",
hline=median(breaks),
vline=median(breaks),
linecol=tracecol,
这个部分的参数具体什么意思,我搞不明白了,跟block sepration到底有什么区别呢?
# Row/Column Labeling
margins = c(5, 5),
ColSideColors,
RowSideColors,
cexRow = 0.2 + 1/log10(nr),
cexCol = 0.2 + 1/log10(nc),
labRow = NULL,
labCol = NULL,
# cexRow 行标名字的字体大小,cexCol为列标名字的大小。
# color key + density info
key = TRUE,
keysize = 1.5,
density.info=c("histogram","density","none"),
denscol=tracecol,
symkey = min(x < 0, na.rm=TRUE) || symbreaks,
densadj = 0.25,

# plot labels
main = NULL,
xlab = NULL,
ylab = NULL,

# plot layout
lmat = NULL,
lhei = NULL,
lwid = NULL,

# extras
...
)
参数———-Arguments———-
参数:x
numeric matrix of the values to be plotted.
数值矩阵的值被绘制。
参数:Rowv
determines if and how the row dendrogram should be reordered. By default, it is TRUE, which implies dendrogram is computed and reordered based on row means. If NULL or FALSE, then no dendrogram is computed and no reordering is done. If a dendrogram, then it is used “as-is”, ie without any reordering. If a vector of integers, then dendrogram is computed and reordered based on the order of the vector.
决定是否和如何应重新排序的行聚类分析。默认情况下,是TRUE,也就说基于行的平均值聚类。如果为NULL或FALSE,则没有聚类分析计算,并没有进行重新排序。
参数:Colv
determines if and how the column dendrogram should be reordered. Has the options as the Rowv argument above and additionally when x is a square matrix, Colv = “Rowv” means that columns should be treated identically to the rows.
决定是否以及如何应重新排序列的聚类分析。同上
参数:distfun
function used to compute the distance (dissimilarity) between both rows and columns. Defaults to dist.
函数,用于计算两个行和列之间的距离(相异)。默认为dist的。
参数:hclustfun
function used to compute the hierarchical clustering when Rowv or Colv are not dendrograms. Defaults to hclust.
函数用来计算的层次聚类Rowv或Colv不树状图。默认为hclust的。
参数:dendrogram
character string indicating whether to draw ‘none’, ‘row’, ‘column’ or ‘both’ dendrograms. Defaults to ‘both’. However, if Rowv (or Colv) is FALSE or NULL and dendrogram is ‘both’, then a warning is issued and Rowv (or Colv) arguments are honoured.
提醒是聚类分析,默认的是none,如果是行聚类分析,则是dendrogram=“row”,否则就会报错。
参数:symm
logical indicating if x should be treated symmetrically; can only be true when x is a square matrix.
逻辑表明,如果x应该被视为对称的,只能是真实的,当x是一个正方形矩阵。
参数:scale
character indicating if the values should be centered and scaled in either the row direction or the column direction, or none. The default is “row” if symm false, and “none” otherwise.
指示如果值应为中心和缩放的行方向或列方向上,或根本没有。默认值是"row"如果symm假的,“none”。
参数:na.rm
logical indicating whether NA’s should be removed.
逻辑NA的指示是否应该被删除。
参数:revC
logical indicating if the column order should be reversed for plotting, such that e.g., for the symmetric case, the symmetry axis is as usual.
逻辑表明,如果列的顺序应该是reversed的图,这样说,例如,为对称的情况下,对称轴是像往常一样。
参数:add.expr
(expr ession 前面的本是一个字符,但是不知道怎么搞的,sina说她是非法字符,只有把它拆开啊) that will be evaluated after the call to image. Can be used to add components to the plot.
表达式将被评估后,调用image。可用于将组件添加到图。
参数:breaks
(optional) Either a numeric vector indicating the splitting points for binning x into colors, or a integer number of break points to be used, in which case the break points will be spaced equally between min(x) and max(x).
(可选的),要么是数字矢量指示的分裂点的像素合并x到颜色,要使用的中断点或整数,在这种情况下, 在中断点将等距离间隔之间min(x)和 max(x)。
参数:symbreaks
Boolean indicating whether breaks should be made symmetric about 0. Defaults to TRUE if the data includes negative values, and to FALSE otherwise.
布尔值,指示是否中断,应对称约0。默认为TRUE如果数据包括负值,并FALSE否则。
参数:col
colors used for the image. Defaults to heat colors (heat.colors). 所使用的颜色的图像。默认为热色(heat.colors)。还有cm.colors(256), topo.colors(256), redgreen(75),
heat.colors()从红色渐变到黄色再变到白色(以体现“高温”、“白热化”)。
terrain.colors()从绿色渐变到黄色再到棕色最后到白色(这些颜色适合表示地理地形)。
cm.colors()从青色渐变到白色再到粉红色。
topo.colors()从蓝色渐变到青色再到黄色最后到棕色。
参数:colsep, rowsep, sepcolor
(optional) vector of integers indicating which columns or rows should be separated from the preceding columns or rows by a narrow space of color sepcolor.
()向量整数列或行应分开从前面的列或行的狭小空间内的颜色sepcolor。
参数:sepwidth
(optional) Vector of length 2 giving the width (colsep) or height (rowsep) the separator box drawn by colsep and rowsep as a function of the width (colsep) or height (rowsep) of a cell. Defaults to c(0.05, 0.05)
(可选)向量的长度为2给予的宽度(colsep)或的高度(rowsep)绘制由colsep和rowsep的的宽度(colsep)作为一个功能或的高度(rowsep)的小区的隔板框。默认为c(0.05, 0.05)
参数:cellnote
(optional) matrix of character strings which will be placed within each color cell, e.g. p-value symbols.
矩阵(可选)将被放置在每一个色彩单元的字符串,例如p-值的符号。
参数:notecex
(optional) numeric scaling factor for cellnote items.
(可选)数字缩放因子cellnote项目。
参数:notecol
(optional) character string specifying the color for cellnote text. Defaults to “green”.
(可选)字符串指定cellnote文字的颜色。默认为“绿色”。
参数:na.color
Color to use for missing value (NA). Defaults to the plot background color.
使用的颜色缺失值(NA“)。默认的图背景颜色。
参数:trace
character string indicating whether a solid “trace” line should be drawn across ‘row’s or down ‘column’s, ‘both’ or ‘none’. The distance of the line from the center of each color-cell is proportional to the size of the measurement. Defaults to ‘column’.
字符串,表示一个坚实的“跟踪”线应画在“行或向下”列的,“都”或“无”。从每种颜色的小区的中心的线之间的距离成比例的大小的测量。默认为“列”。是否将图根据数值的个数进行分割
参数:tracecol
character string giving the color for “trace” line. Defaults to “cyan”.
“跟踪”行字符串的颜色。默认为“青色”。分割线的颜色。
参数:hline, vline, linecol
Vector of values within cells where a horizontal or vertical dotted line should be drawn. The color of the line is controlled by linecol. Horizontal lines are only plotted if trace is ‘row’ or ‘both’. Vertical lines are only drawn if trace ‘column’ or ‘both’. hline and vline default to the median of the breaks, linecol defaults to the value of tracecol.
向量的单元内的值,其中应绘制的水平或垂直的虚线。颜色的线是由linecol。如果只绘制水平线trace是行或所有人。只画垂直线trace列或都。
hline和vline默认情况下,截断的中位数,linecol的价值tracecol默认。 分割线分割后的小格子继续分割
参数:margins
numeric vector of length 2 containing the margins (see par(mar= *)) for column and row names, respectively.
数字矢量长度为2的边缘(见par(mar= *))列名和列名,分别。
参数:ColSideColors
(optional) character vector of length ncol(x) containing the color names for a horizontal side bar that may be used to annotate the columns of x.
(可选)字符向量,长度为ncol(x)含有可以用于标注的列x的水平边栏的颜色名称。
参数:RowSideColors
(optional) character vector of length nrow(x) containing the color names for a vertical side bar that may be used to annotate the rows of x.
(可选)字符向量,长度为nrow(x)包含可用于注释行x的垂直边栏的颜色名称。
参数:cexRow, cexCol
positive numbers, used as cex.axis in for the row or column axis labeling. The defaults currently only use number of rows or columns, respectively.
正数,作为cex.axis中的行或列轴标签。默认值目前只使用数量的行或列。
参数:labRow, labCol
character vectors with row and column labels to use; these default to rownames(x) or colnames(x), respectively.
特征向量与使用的行和列标签;这些默认rownames(x)或colnames(x),分别。
参数:key
logical indicating whether a color-key should be shown.
逻辑表明是否应该显示的颜色区分表
参数:keysize
numeric value indicating the size of the key
数字值,颜色区分表的大小的
参数:density.info
character string indicating whether to superimpose a ‘histogram’, a ‘density’ plot, or no plot (‘none’) on the color-key.
字符串指示是否叠加“直方图”,“密度”图,或没有图(“无”)上的颜色键。
参数:denscol
character string giving the color for the density display specified by density.info, defaults to the same value as tracecol.
的密度为相同的值作为density.infotracecol,默认显示指定的字符串的颜色。
参数:symkey
Boolean indicating whether the color key should be made symmetric about 0. Defaults to TRUE if the data includes negative values, and to FALSE otherwise.
布尔值,指示是否应在0对称的颜色键。默认为TRUE如果数据包括负值,并FALSE否则。
参数:densadj
Numeric scaling value for tuning the kernel width when a density plot is drawn on the color key. (See the adjust parameter for the density function for details.) Defaults to 0.25.
数字缩放值调整内核的宽度时,密度图上绘制的颜色键。 (adjust功能的详细信息,请参阅density参数),默认为0.25。
参数:main, xlab, ylab
main, x- and y-axis titles; defaults to none.
主,X轴和Y轴标题,默认为none。
参考网页:
http://fhqdddddd.blog.163.com/blog/static/186991542010920911297/ http://www.biostatistic.net/forum.php?mod=viewthread&tid=43964
http://flowingdata.com/2010/01/21/how-to-make-a-heatmap-a-quick-and-easy-solution/
http://f.dataguru.cn/thread-214003-2-1.html
调节键值:http://stackoverflow.com/questions/15351575/moving-color-key-in-r-heatmap-2-function-of-gplots-package
